BRISBANE HEAT CASE STUDY: Part 2 – Big Show must go on

Blog, Case Study

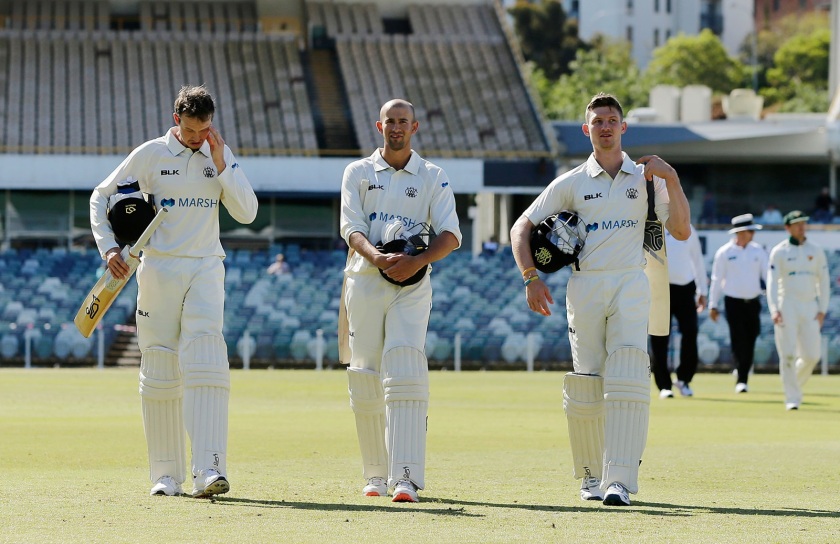
Following Brisbane Heat’s somewhat disappointing 29-run loss to Sydney Thunder at the Gabba, the team had just three days to bounce back against the Melbourne Stars at Carrara Stadium (known commercially as Metricon Stadium). No doubt the loss was discouraging, especially after the team had shown patches of promise in their opening match, but the Big Bash League’s longer 14-game season allowed plenty of opportunity for the Heat to make an improvement in their performance.

Before the game even began however, they had a few things going against them. For starters, the Heat had yet to win a game at their second home ground on the Gold Coast. Last season, they slumped to narrow losses against both Hobart Hurricanes and Sydney Sixers after they had held the ascendency on both occasions. Meanwhile, the Stars triumphed over the Thunder at the same venue.

The other problem was that having taken a short break from cricket, T20 superstar Glenn Maxwell was set to make his return for the Melbourne Stars. In Maxwell, the Stars would be boasting a significantly beefed up squad compared to that of last season when Ben Cutting (81 off 30 balls) and Max Bryant (71 off 30 balls) pounded 158 from just 10 overs to win in a canter the last time the two teams met.

Like the Heat, Camp Melbourne had been busy recruiting during the 2019 off-season and had acquired both Hilton Cartwright and Nathan Coulter-Nile from Perth Scorchers. They were also able to retain the services of prominent players such as Marcus Stoinis, Ben Dunk and Nepalese leg spinner Sandeep Lamichhane. However, and perhaps luckily for Brisbane, the Stars’ number one recruit, South African quick Dale Steyn boasting 439 Test wickets, was sidelined with a side strain. He had been replaced last-minute by Pakistani paceman Haris Rauf who had been playing Premier Cricket in Tasmania.

Between this game and the last, the Heat retained the same squad of 13 players that took on Sydney Thunder. For this game though, wicketkeeper James Peirson made the starting XI ahead of fast bowler Mark Steketee and would take the gloves instead of Tom Banton. This came almost as a surprise considering Steketee’s figures of 1-37 off four overs with the ball and watchful 15 off 17 balls with the bat on a night where he outscored batsmen Max Bryant, Chris Lynn and Sam Heazlett.

Game 2: Melbourne Stars (20/12/2019)

Glenn Maxwell 83 v Brisbane Heat (Getty Images)

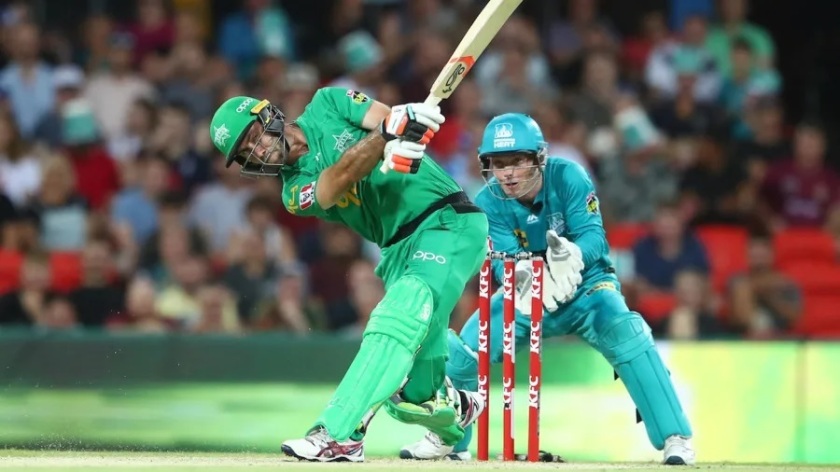
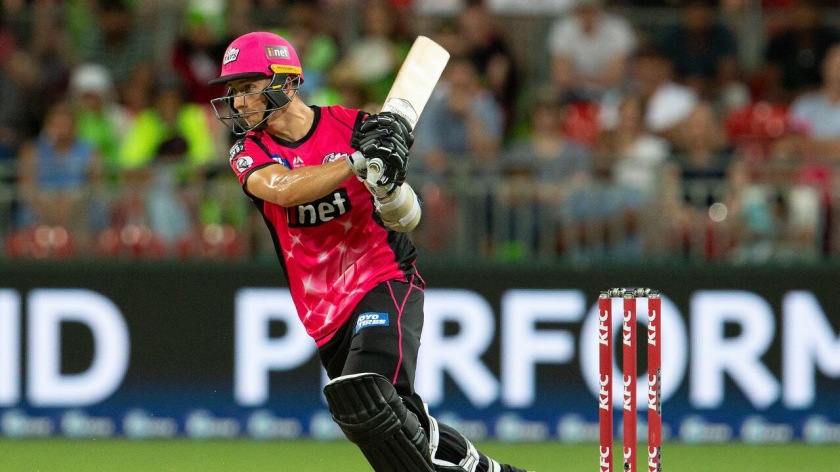
Melbourne Stars captain Glenn Maxwell made 83 off 39 balls to lift his team to 6-167 in a fine return to cricket // Getty Images

Despite losing their last game by 29 runs when they were asked to bat second, Heat captain Chris Lynn won the toss and voluntarily elected to field first in front of 11,969 fans at Metricon Stadium. Batting second has quickly become the preferred option in the BBL since a team batting second knows how many runs they need to reach its target, while the team batting must first estimate a reasonable target to set. On this occasion, Lynn was proven wise in his choice as the Heat bowlers again started strongly.

Key Moment 1 – Opening Heat bowlers leave formidable Stars reeling

With the new ball in hand again, Josh Lalor started well for Brisbane against Nic Maddinson until a thumping six over deep backward square leg spoilt an otherwise superb over. Normally a batsman, Matthew Renshaw was handed the ball for the second over of the game. Marcus Stoinis managed just a single off the first four balls of the over before Maddinson backed away and tried to drive the first ball he faced from Renshaw to the off-side. Unfortunately for Maddinson, he succeeded only in mis-timing it straight into the hands of Josh Lalor at backward point to give Brisbane the perfect start.

Lalor was in the thick of the action again as he removed first drop Hilton Cartwright for 18 to leave Melbourne Stars at 2-42 after the powerplay scoring at just 7 runs per over. Stoinis joined him in the dugout not long after him for just 16 when he skied a drive high into the air to give Sam Heazlett his fourth catch of the season, but not before he was gifted a boundary courtesy of a Mitchell Swepson mis-field on the boundary.

With wickets coming regularly and the Heat bowlers applying pressure with tight lines and lengths, Glenn Maxwell joined Peter Handscomb in the middle and they set to work rebuilding the innings. With everything going the Heat’s way though, this partnership did not last long. Non-striker Maxwell tried to pinch a single to wicketkeeper James Peirson following an inside edge off Handscomb’s bat. A swift removal of his glove allowed Peirson a shy at the stumps down the non-striker’s end and he coolly took it, gunning down Handscomb for 20 and leaving the Stars reeling at 4-75 at the halfway stage (7.5 rpo).

Key Moment 2 – Sharp chance to remove Maxi triggers game change

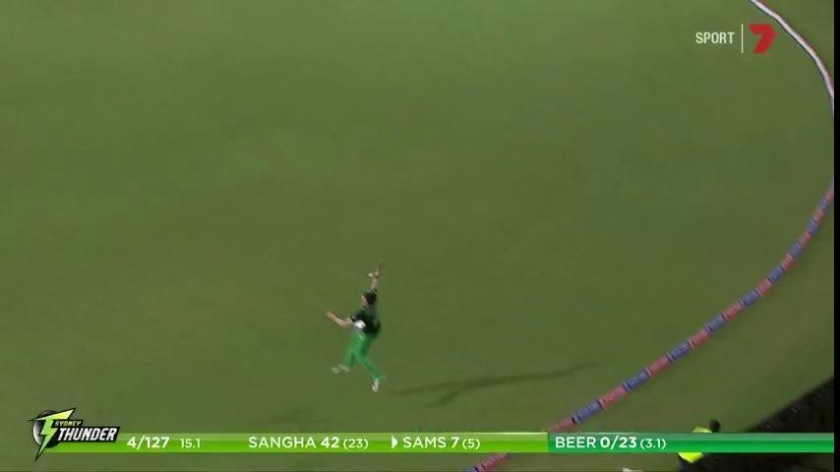
With the first ball of his third over, and just the second delivery following the Handscomb run out, Afghani spinner Zahir Khan served up a juicy full toss outside off stump to Glenn Maxwell. Maxwell slammed it down the ground towards long off. Ben Laughlin ran to his right, leapt and flew to his right with arms extended. The 37-year-old got his hands on the ball and nearly took the catch of the summer, but couldn’t hold on as the ball trickled into the boundary.

Cricket Australia’s ‘Fair Play’ data analysis system categorises fielding efforts into three grades, depending on the difficulty involved. Grade 1 counts for the most straightforward of chances while Grade 3 is the most difficult to complete, a one-handed diving grab for example. With this in mind, anyone watching the vision can definitively state that the opportunity afforded to Laughlin was at least Grade 2, or 3. That is to say the only reason this became an opportunity in the first place was because of Laughlin’s anticipation, speed to the ball, and sheer athleticism.

You can’t fault Laughlin for trying and failing. His effort alone is all the more impressive given his age. Be that as it may, the Heat missed their one opportunity to remove Maxwell for just 12 and have the Stars at 5-75 and looking at a score of 140-150. Instead, Laughlin himself finally dismissed Maxwell with two balls remaining in the innings when the right-hander played onto his stumps. The damage was already done. Maxwell’s inspired 83 off just 39 balls lifted the Stars beyond 160 with the dropped catch costing the Heat a whopping 71 runs.

Key Moment 3 – One-man Big Show lifts Stars into the stratosphere

With the score at 4-75 after 10 overs, Glenn Maxwell launched. Following Laughlin’s dropped catch Maxwell elevated the run rate to 10.5 rpo between the 11th and 14th overs until Ben Dunk departed for 11 at a run per ball, interestingly caught by Ben Laughlin. Clint Hinchliffe came and left while Adam Zampa would only contribute 5 runs at a strike rate of 55.55, leaving all the pressure on Maxwell to make the runs.

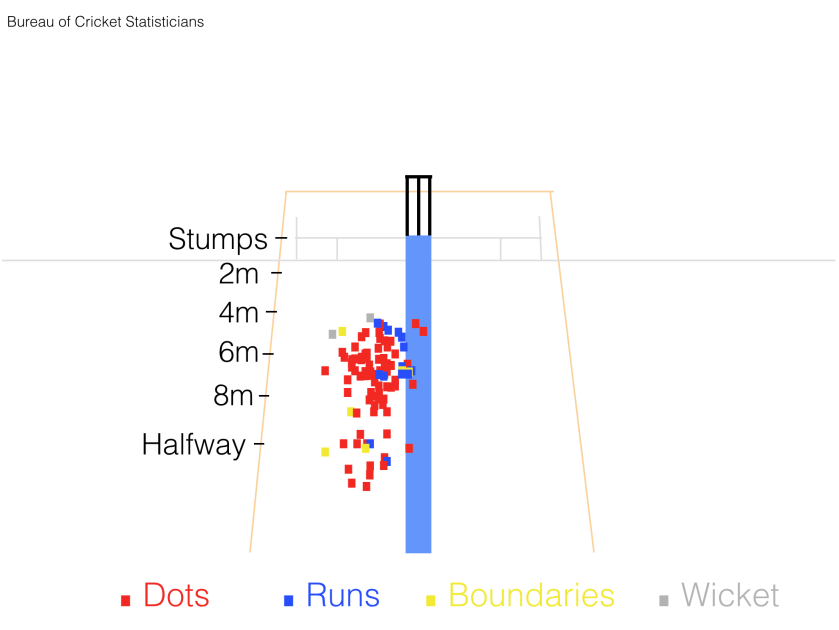
As his teammates struggled with rhythm, Maxwell continued to find the boundary and flummox the Heat bowlers as he smashed 67 off just 32 balls at 209.38 in the overs following his earlier lifeline. His precise footwork against the spin combination of Zahir Khan and Mitchell Swepson was on full display as he crunched 33 off just 17 balls against Brisbane’s spin twins. The 31-year-old equalled his fastest BBL half-century on his way to 83 off just 39 balls, which made up 49.7 percent of Melbourne Stars’ final tally. Peter Handscomb’s 20 remained the second-highest score. Additionally, he scored runs from 33 of the 39 balls he faced at a scoring shot percentage of 84.6.

Match 2 Heat v Stars - Maxwell's impact chart

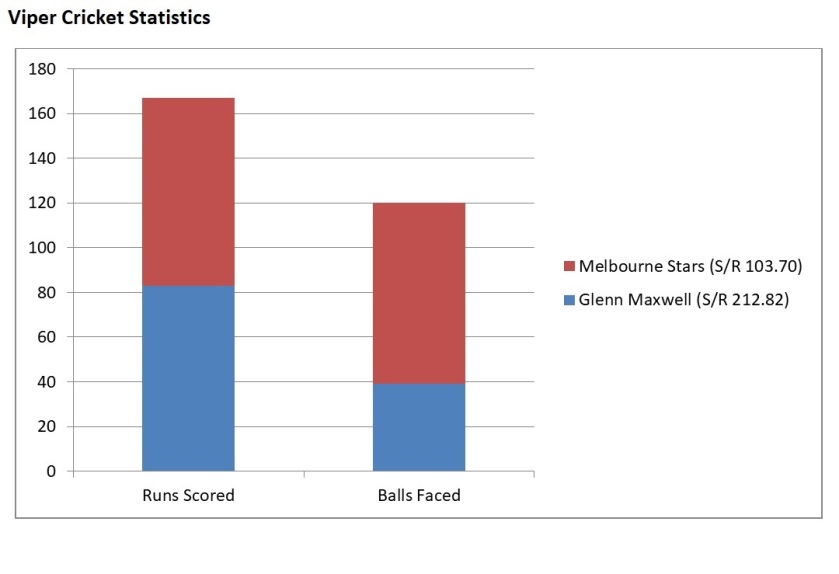
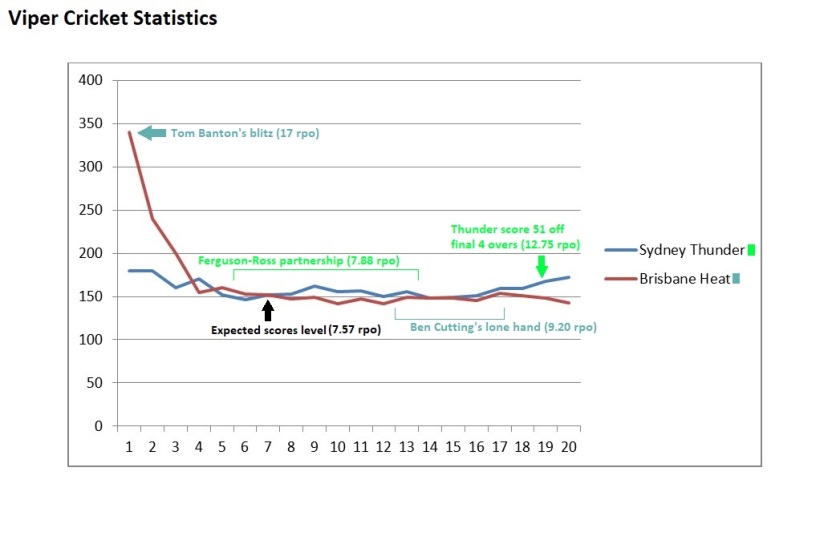
This chart demonstrates the impact Glenn Maxwell had on the game. As we can see, Maxwell (blue) scored 49.7 percent of the Melbourne Stars runs at 212.82 in just 32.5 percent of the 20 overs // Viper Cricket Statistics

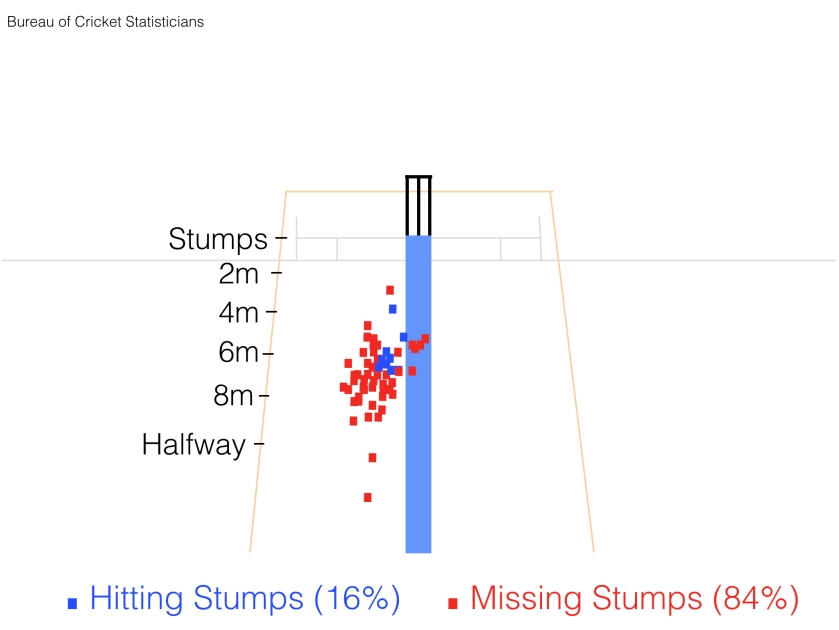
Brisbane Heat’s death bowling again let them down, not to the extent of the previous game against the Thunder but, the Stars were still able to hit 49 off the last 5 overs at 9.8 rpo to finish their innings at 7-167. Each of the six Heat bowlers took one wicket each as Zahir Khan finished with an economy rate of 7.25 rpo, the lowest of all (aside from Matthew Renshaw’s one over). Fellow spinner Mitchell Swepson finished with the highest economy rate (9.25 rpo), a stark contrast to the last game where he took 2-11 at 5.50 rpo.

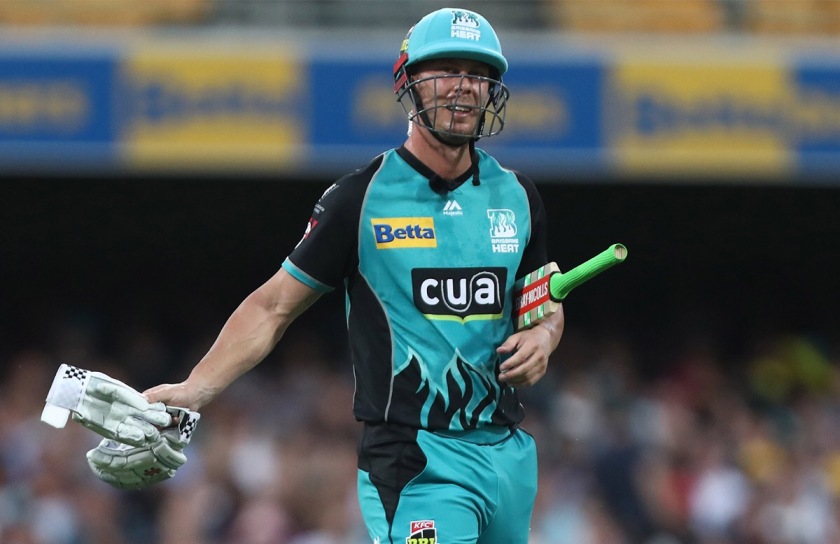
Key Moment 4 – Banton undeterred by Rauf’s flying start

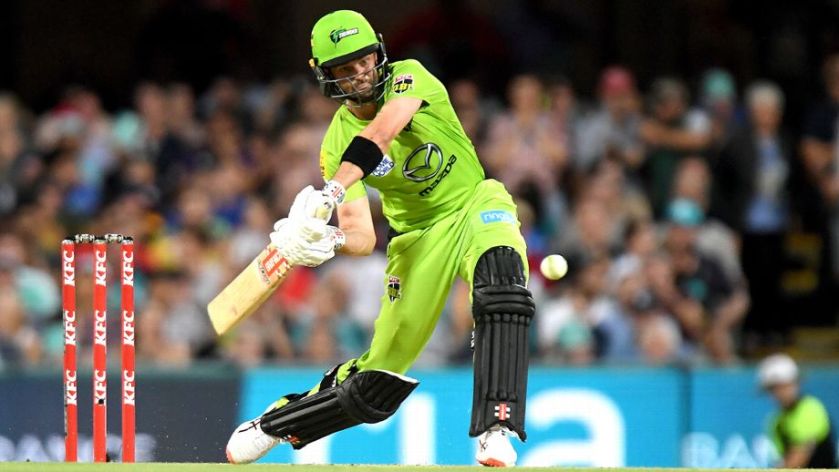
Daniel Worrall began the second innings by giving up just 3 runs in the opening over, but Englishman Tom Banton made sure it didn’t stay that way. Beginning with just the second ball of spin he’s ever faced in the BBL, Banton went after Sandeep Lamichhane and swatted 15 off 4 balls from the Nepalese leg spinner. Max Bryant added another four before the over’s end to take the score to 0-22 after two overs.

Bryant’s stay at the crease was again brief as Pakistan’s Haris Rauf made the perfect start to his BBL career with Bryant caught down the leg-side off his first delivery. Banton was left unfazed by Bryant’s dismissal and struck four more boundaries, including two consecutive fours against Adam Zampa, during the powerplay as the Heat looked on track at 1-57. When the 21-year-old notched up a 29-ball fifty in style with a pull shot six over deep mid-wicket in Zampa’s second over, he had scored 36 runs off 17 balls of leg spin. However, the leg spinner would get his revenge soon enough.

Key Moment 5 – Brisbane Heat stumble at halfway mark

Just three balls after Tom Banton brought up his maiden BBL half-century, Chris Lynn fell cheaply when he came down the track against Adam Zampa and picked out Ben Dunk at long on. Not the best batting by the captain considering Banton was playing so well and Lynn was back in the dugout for just 6 off 9 balls. Banton soon followed him though for a well-made 64 off 36 balls when he gave Zampa a second wicket, and Dunk a second catch. Banton scored 64 of the Heat’s first 81 runs and his wicket left the match evenly poised.

Two fresh batsmen, Matthew Renshaw and Ben Cutting, struggled to score freely against Melbourne Stars’ spin bowlers and Haris Rauf made life difficult for Cutting when his second over – the 11th overall – went for just one run. The pair added just 19 runs off 25 balls for the fourth wicket as the Heat scored at just 5 rpo between and went almost five overs without a boundary mid-innings. When Cutting gave Dunk a hat trick of catches on 12 in the 14th over, Brisbane Heat were 4-100 and in search of 68 off 39 balls at 10.8 rpo.

Key Moment 6 – Renshaw given no help in wicket procession

Matthew Renshaw began strong by reverse sweeping the first delivery after Ben Cutting’s dismissal for four over third man. He also helped the Heat take 12 off the next over, bowled by Glenn Maxwell, with a six and a four to close out what was otherwise a good over for the Stars. With a final scoring shot percentage of 73.3, Renshaw kept Brisbane Heat in the game with some impressive strokeplay and running between the wickets.

Melbourne Stars captain Maxwell rotated his bowlers to perfection and ensured the Heat batsmen couldn’t find any continuity. Sam Heazlett edged behind for just 4 to give Adam Zampa (3-30) his third wicket as no batsman after him added more than five runs. Renshaw fought hard for his 39 off 30 balls, but was eventually bowled when he tried to ramp Daniel Worrall (2-21). His four off Maxwell was the last Brisbane Heat would score as the team added just 27 and failed to hit a single boundary during the last five overs with Haris Rauf (2-20 off 4 overs) sealing the deal, the Heat finishing with 8-145.

WHERE THE GAME WAS LOST

On this night out at the Gold Coast, the point at which the game was lost is twofold. We already mentioned above in detail that Glenn Maxwell was on just 12 when he was dropped by Ben Laughlin. A fantastic diving effort from the 37-year-old only became an opportunity through anticipation and sheer athleticism, so no fault on Laughlin’s part, but it was a moment that would have left Melbourne Stars at 5-75 and Ben Dunk (11 off 11) batting with Clint Hinchliffe (0 off 6).

Despite the fact that the dropped catch cost the Heat a total of 71 runs, there’s a certain point at which you just have to accept that Glenn Maxwell had a day out with the bat and there was nothing the Brisbane Heat bowlers could do about it. It truly was a captain’s knock, an outlier of a performance if you will. In fact, Maxwell’s whirlwind knock of 83 off just 39 balls actually is a mathematical outlier.

In statistics, an outlier is an extremely high or extremely low value.  We determine extreme by being 1.5 times the interquartile range above Q3 or below Q1. That’s a little bit complicated for anyone that does not have a detailed knowledge of such a topic but, don’t worry. We’ve done the maths for you. In short, since Peter Handscomb’s 20 remained the second-highest score by a Melbourne Stars batsman (and nobody else scored above 20) an extremely high outlier would be any score higher than 37.5. Maxwell’s 83 runs are more than double that on its own and actually equates to 5 times the interquartile range above Q3. Tom Banton and Matthew Renshaw’s innings’ are also outliers amongst the Brisbane Heat.

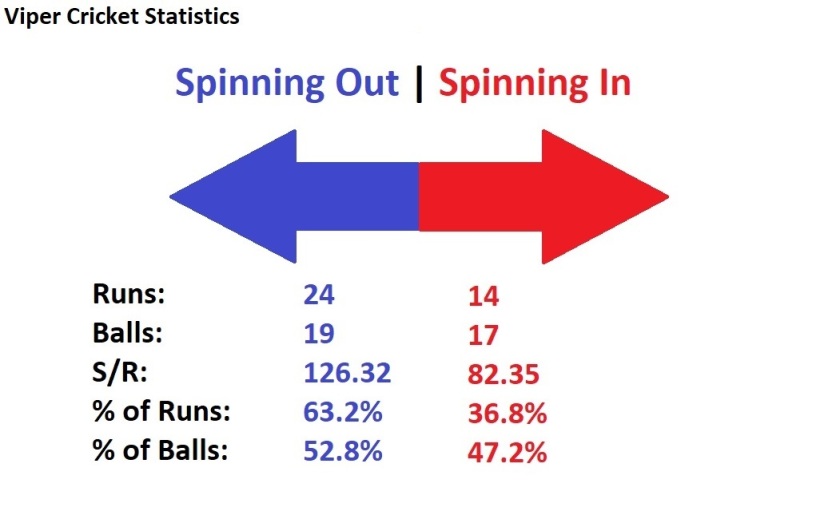
The second point at which the game was lost was Brisbane Heat’s batting innings. Save for Adam Zampa, the Heat’s batsman saw a major improvement in their ability to play spin. Sandeep Lamichhane went at 9.50 rpo while both Glenn Maxwell and Clint Hinchliffe leaked 10 or more runs from one over each. Brisbane’s record against spin and seam bowling was almost reversed that of the Sydney Thunder game with figures of 4-104 at 8.67 rpo from 12 overs of spin compared to 4-41 at 5.13 rpo off 8 overs of seam.

Haris Rauf made a serious first impression with the ball while Daniel Worrall’s unbroken pressure, at a dot ball percentage of 45.8, meant that the Heat were forced to take extra risks against the spinners. Maxwell rotated his bowlers to perfection with six different bowlers bowling the six overs between the 14th and 19th overs which ensured the Heat batsmen couldn’t find any continuity. No boundaries were scored from two overs of Nic Maddinson and only three were scored between Rauf and Worrall, the same as Ben Cutting by himself. This would prove to be the difference between the two sides.

OTHER FACTS & FIGURES

  • Ben Dunk took three great catches and got his hands on the ball a total of 13 times. He finished the innings with just 4.3 touches per dismissal with 23 percent of all his touches resulting in a wicket.
  • The highest partnership of the match was shared between Glenn Maxwell and Adam Zampa. Maxwell scored 40 of the 47 runs (85.1%) off just 20 balls.
  • Glenn Maxwell and Tom Banton were the only batsmen to pass fifty runs and Matthew Renshaw was the only other batsman, out of nineteen, to score more than 20 runs.
  • The pull shot was the most productive shot utilised by both Glenn Maxwell and Tom Banton. Between them, the pair made 42 runs from the pull shot including two fours and five sixes.

SUMMARY

Brisbane Heat’s opening bowlers applied pressure early on with tight lines and lengths and had the Melbourne Stars at 4-75 after 10 overs. Enter Glenn Maxwell. Staring down the barrel of a total between 140 and 150, Maxwell almost single-handedly lead Melbourne Stars at 9.2 rpo during the last 10 overs, and 9.8 rpo during the last five, to lift his side to 167. This proved to be too much for Brisbane Heat’s batters.

Bowling at the death again let Brisbane Heat down slightly, but it was a great improvement. Meanwhile, English import Tom Banton was left to chase down 168 runs almost on his own as the rest of the Brisbane Heat lineup, with the exception of Matthew Renshaw, stalled for the second time in two matches. The Brisbane Heat management did a great job of recruiting in the off-season, but the cracks are already showing. T20 superstar AB de Villiers is set to join the Heat later in the season as a replacement for Banton, but neither of them are a “one-man solution” for the team’s problems. A change has to come from their home grown players, especially when a bout of illness prevents Banton from playing the Heat’s third game of the season against the Sydney Sixers…

More to come…

CASE STUDY: What the heck happened to the Brisbane Heat? – Part 1

Blog, Case Study

The Brisbane Heat seemed like the team to beat in the 2019-20 edition of the Big Bash League. Having previously coached the team to Big Bash glory in 2012-13, Darren Lehmann returned to coach the team after a spell as coach of the Australian national cricket team.

Lehmann had coached the Australian team to Ashes wins and a World Cup win since then, but he had been forced resigned an Australian coach in the wake of the Cape Town ball-tampering scandal. Lehmann was –  and is – a proven winner. If anyone could take Brisbane Heat back to their winning ways, it would surely be the man that got them there in the first place.

Brisbane’s record in the Big Bash is mortifying. Their success in the 2012-13 final against the Perth Scorchers remains their most recent knockout win. They were the only team not to have played multiple finals matches between 2013 and 2017.

The desire for reinvention this season was essential for the team after four largely disappointing seasons and the departures of former coach Daniel Vettori and legendary batsman Brendon McCullum.

Behind the scenes, batsman Alex Ross and fast bowler Brendan Doggett created holes in the squad after both accepted a move to the Sydney Thunder, but the Heat worked hard and recruited well during the off-season. 18-year-old off spinner Mujeeb Ur Rahman was set to return to the Heat along with new international signings Zahir Khan and Tom Banton.

Brisbane Heat had also managed to poach death bowling specialist Ben Laughlin from the Adelaide Strikers and, somehow, recruit former South African limited overs captain AB de Villiers. De Villiers is regarded as one of the greatest batsmen of all time and he, along with established Heat stars Chris Lynn, Joe Burns, Matthew Renshaw, James Pattinson and Ben Cutting would form a crucial part of the batting lineup.

With so much promise emanating from the team’s 20-man squad, the only way was up. Lehmann leading this team had the earmarks of success. So how, after just two months of competition, did the Brisbane Heat’s 2019-20 BBL campaign come crashing down so swiftly? How did it all go so wrong?

We are going to look at every game the Heat played this summer and break them down in order to try and pinpoint where each match was won or lost. By looking at the numbers, we can look at individual and team performances, as well as key moments in a much more in-depth manner. Prepare yourself for a lot of crazy numbers.

Game 1: Sydney Thunder (17/12/2019)

Callum Ferguson slugs one into the leg side -- Getty Images

Sydney Thunder captain Callum Ferguson made 73 not out off 44 balls to lift his team to 6-172 in the opening match of the 2019-20 Big Bash League // Getty Images

Sydney Thunder won the toss and elected to bat when they came up to the Gabba to face Brisbane Heat in the opening match of the 2019-20 Big Bash League. That proved to be a splendid idea as Usman Khawaja hit Josh Lalor for two fours in his first three balls.

Key Moment 1 – Lalor denied Khawaja wicket: Lalor fired back on his fourth ball and had Khawaja trapped in front with a brilliant length ball that was hitting the middle of middle stump. The umpire shook his head, perhaps believing that Khawaja had got a little inside edge but, replays showed otherwise. The 2019-20 BBL season was just four balls old and the Heat had already missed out on a wicket. This would ultimately cost them 14 runs as Khawaja went on to score three more boundaries on his way to 22 off 13 balls, striking at 169.23.

Lalor finally got his man in his second over, the third of the match, as Khawaja top edged a hook shot to fine leg that was smartly caught by Sam Heazlett. Heazlett was everywhere in the field and added two more catches to his tally as the Thunder slipped to 3-38 after five overs.

Key Moment 2 – Ferguson and Ross partnership: With the Thunder reeling at 3-44 after the powerplay, former Brisbane Heat player Alex Ross joined Sydney Thunder captain Callum Ferguson at the crease. The pair put on 63 off 50 balls, striking at 126, for the fourth wicket in what would prove to be a crucial partnership.

Sydney Thunder’s run rate was 7.60 when the pair came together despite losing three wickets inside the powerplay. Over the next 8 overs, the pair were able to maintain a run rate of 7.88 before Alex Ross was caught for 30 off 27 balls trying to reverse sweep Heat leg spinner Mitchell Swepson in the 14th over.

Key Moment 3 – Brisbane Heat death bowling: Having just dismissed Ross, Mitchell Swepson bowled Daniel Sams with a perfectly pitched googly to put himself on a hat-trick. This should have seen a momentum shift in the game for the Heat. Instead, Ferguson launched an assault of 31 runs off 16 balls at a strike rate of 193.75‬ in the final five overs and finished with 73 not out off just 44 balls. He was the only batsman to score more than 30 runs for the entire match.

Batting with spinner Chris Green, the pair combined in another crucial partnership of 42 runs off 28 balls at a strike rate of 150. Green hit two fours and a six on his way to 25 off just 17 balls which allowed the Thunder reach a final score of 6-172 as Brisbane Heat’s seam bowlers conceded 51 runs off the final four overs at 12.8 runs per over.

Brisbane Heat’s bowlers could consider themselves unlucky with 21 of those 51 runs (41.2%) coming from a total of five top, thick and inside edges. An additional four byes were also recorded when a good Ben Laughlin off cutter spun past wicketkeeper Tom Banton to the boundary. Nevertheless, the Thunder scored around 15-20 more runs than they should have done off the final four overs with even 10 rpo during that period enough to restrict them to a chasable 161.

Key Moment 4 – Tom Banton’s opening over blitz: Needing to score an unimposing 8.65 runs per over, Heat opener Tom Banton began his BBL career by innocuously shouldering arms to Daniel Sams’ first ball. He must’ve liked what he saw of Sams though as he hit two sixes over deep midwicket and a four to give the Heat 0-17 off the first over.

Banton was keen for runs and couldn’t resist the urge to advance Jono Cook off the first ball he faced from the spinner. Unfortunately for the Englishman, and the Heat, he was only successful in flicking the ball to Nathan McAndrew at deep mid wicket. Banton’s blitz of 16 off 7 balls at 228.57 had come to an abrupt end with the Heat now 1-18.

Key Moment 5 – Scoreboard pressure and lack of partnerships: Slow starts for Max Bryant (11 off 10 balls) and Chris Lynn (9 off 9 balls) meant the Heat scored at just 5.8 rpo between the second and sixth overs. Both players returned to the dressing room in consecutive overs to leave the Heat in a similar position to the Thunder after the powerplay with the score at 3-46. In fact, the match was so close at one stage that both teams were 3-53 after seven overs, scoring at 7.57 rpo.

Unlike how Ferguson and Ross were able to maintain the run rate however, the Thunder’s spinners Chris Green, Arjun Nair and Cook applied the brakes as Sam Heazlett and Matthew Renshaw struggled to score above 7 runs per over. Heazlett was eventually caught at long on by Alex Hales for just 12 off 12 balls when he tried to slog sweep Nair while Renshaw fell for 26 off 24 balls, also trying to slog sweep a spinner.

Key Moment 6 – Ben Cutting’s last stand: Left batting with fast bowler Mark Steketee, Ben Cutting was the top-scorer for the Heat with 28 off 18 balls, striking at 155.55, which included two fours and two sixes. Cutting helped the Heat score at 8.6 rpo during the 7.2 overs he spent at the crease and, almost single-handedly, scored at 9.2 rpo from the 13th over until he was finally bowled by Daniel Sams in the 17th over.

Whereas Sydney Thunder scored 51 runs off the final four overs, Brisbane Heat lost 5-32 in the final five overs as the team limped to 143 all out off 19.2 overs. Steketee should have been out for just 1, but escaped being caught on the boundary when Nathan McAndrew touched the rope with his heel. Wickets fell in procession after Steketee was bowled by Green for 15 with Josh Lalor running himself out just two balls later. Cutting was all set to launch and hit two sixes off Daniel Sams before he too, was bowled. With the rest of the tail cleaned up easily, Sydney Thunder took a comfortable win by 29 runs.

Heat v Thunder Expected Score Chart_002 -- Viper Cricket Statistics

This chart plots the expected score each team would make based on their run rates at the conclusion of each over. Key moments of the match have also been highlighted // Viper Cricket Statistics

WHERE THE GAME WAS LOST – Spin to win

Each team’s ability to utilise their spin bowlers proved to be the key difference between the two teams. At a venue known for providing assistance to the quicker bowlers, it is vital for teams to make the most of their spin bowling options.

Having just dismissed Alex Ross in the 14th over, Mitchell Swepson bowled Daniel Sams with a perfectly pitched googly to put himself on a hat-trick. Sams was playing for the leg break, but the ball spun the other way through the wide open gate and crashed into the stumps.

Swepson’s googlies, or wrong ‘uns, were an effective weapon against the Thunder on this night with the Thunder batsmen only able to score 2 runs from the 5 googlies he bowled, striking at 40. The 26-year-old finished with figures of 2-11 off just two overs, conceding just one boundary.

His length was also key. Of all the deliveries Swepson bowled, seven of them (or 58.3%) were either half volley or good length balls with the Thunder batsmen only able to score 3 runs off deliveries of that kind – a strike rate of 42.86.

When Swepson dropped shorter however, the Thunder batsmen were able to score more freely with a strike rate of 100 from four back of a length deliveries. Alex Ross also hammered Swepson’s only short ball to the deep forward square boundary. Apart from that boundary, Ross was only able to score two singles off the other four balls Swepson bowled to him.

Afghanistan left-arm leg spinner Zahir Khan also bowled well in his debut for the Heat and finished with 0-27 off his four overs. He was the only Heat bowler unable to take a wicket but, like Swepson, Khan leaked just a single boundary and generally had more success with half volley or good length balls. The Thunder batsmen scored 16 runs off 17 balls of that kind, striking less than a run per ball at 94.12.

While Swepson had around a 60-40 ratio of leg spin deliveries to googlies respectively, Khan’s was 50-50. His unorthodox left-arm leg spin proved to be marginally more effective than his googlies with the Thunder batsmen striking at 100 versus 125 against googlies. These numbers from both of Brisbane Heat’s spinners suggest that right-handed Thunder batsmen have weakness against balls spinning into them.

Heat Spinners v Thunder

This graph illustrates the effectiveness of the Brisbane Heat spinners when they spun the ball into right-handed Thunder batsmen. The difference in strike rates alone is worth 2.6 runs per over // Viper Cricket Statistics

Together, Khan and Swepson finished with figures of 2-38 off six overs at 6.33 runs per over compared to the team’s four seam bowlers who took 4-134 off 14 overs at 9.57 rpo. The pair also had a strike rate of 18 compared to 21 for the fast bowlers.

Sydney Thunder’s three spinners had near-identical economy and strike rates of 5.83 and 12 in the second innings. However, they finished with figures of 6-70 from 12 overs compared to their seamers who took 3-69 off 7.2 overs at 9.58 rpo and a strike rate of 15.

It is harder for seam bowlers to defend runs at the Gabba because often they are asked to bowl at the shorter boundary from the Vulture Street End. As a result, only four of the 20 overs bowled from the Vulture Street End were by spinners. Facing spin, batsmen from both teams were scoring at 9.50 rpo compared to just 5 rpo to the longer Stanley Street boundary.

Sydney Thunder’s trio of spinners bowled well to apply the brakes and dry up the Heat’s runs. The Heat’s batsmen were only able to score at 4.56 rpo from the nine overs of spin bowled from the Stanley Street End. This would prove to be the difference between the two sides with the Heat losing a wicket for every two overs of spin.

OTHER FACTS & FIGURES

  • Fielding on the boundary for much of the innings, Sam Heazlett took three great catches and got his hands on the ball a total of 25 times, more than any other Heat player. He also finished the innings with 8.3 touches per dismissal with 12 percent of all his touches resulting in a wicket.
  • Ferguson and Ross’ 63-run partnership made up 36.6% percent of the Thunder’s final tally of 172. That’s just over one-third of the entire team’s score. Alex Ross’ 30 made up 17.4% of the Thunder’s final score while Callum Ferguson contributed 42.4% with his classy innings of 73 not out off 44 balls.
  • Sydney Thunder’s spinners Jono Cook, Chris Green and Arjun Nair bowled 9 of the 9.2 overs bowled from the longer Stanley Street End boundary.
  • Facing spin, batsmen from both teams scored 38 runs off 24 balls at a strike rate of 158.33 (9.5 rpo) hitting towards the shorter Vulture Street End compared to 70 runs off 84 balls at 83.33 (5 rpo) towards the Stanley Street End. The difference in strike rates in worth 4.5 runs per over.

SUMMARY

Bowling at the death has always been an issue for Brisbane Heat’s bowlers, hence the acquisition of death bowling specialist Ben Laughlin during the off-season. This game however, was no exception. The final four overs of Brisbane Heat’s bowling innings undid their hard work early on after they had the Thunder at 5-121 after 16 overs and staring down the barrel of a final score between 150-155. Laughlin himself bowled two of the final four overs and conceded 27 runs at 13.5 rpo to help the Thunder reach 6-172.

Meanwhile, Brisbane Heat’s batsmen struggled to free their arms against the Thunder’s trio of spinners. The Heat only manged to score 6-70 at 5.83 rpo off 12 overs of spin with that run rate dropping further to just 4.56 rpo from the nine overs of spin bowled from the longer Stanley Street End boundary. Facing spin has generally been a weakness for Brisbane Heat’s batsmen and it’s something they will have to work in the future.

More to come…

Maxwell and Weatherald named our Most Complete Batsmen… so far

Blog

Marcus Stoinis may be the proud owner of the lucrative Golden Hat for the highest run-scorer during this season’s Big Bash League however, closer inspection reveals two cricketers who have the complete package.

In response to the Golden Bat award for this season’s leading run-scorer in the Big Bash League, we have developed our own award for the batsman whom we believe has had the most impact during this summer’s tournament and has, therefore, been the Most Complete Cricketer this season.

Our core metrics not only take into account a batsman’s run output, like the Golden Bat, but their scoring rate, boundary hitting and versatility also become determining factors in whether they have been a complete cricketer or not this season.

We ran the numbers through our computers and they spat out some interesting results.

Marcus Stoinis, fresh off his staggering 147 from 79 balls against the Sydney Sixers, may have scored more runs than anyone else this season, but it’s his Melbourne Stars team-mate Glenn Maxwell who rates highest on our list alongside Adelaide Strikers’ Jake Weatherald.

Maxwell currently sits in third on the top run-scorers list (316) while Weatherald (293) has fallen down to seventh after leading the run-scoring early in the season. That said however, both players still remain in the uppermost quartile of run-scorers in 2019-20.

Maxwell, of course, rates highly in terms of scoring rate. The 31-year-old’s strike rate of 170.81 is the fifth-highest amongst those that have faced more than 25 balls and the second-highest by a batsman, behind only Tom Banton with Chris Lynn, Liam Livingstone and Mitchell Marsh also rating highly.

Weatherald sits just behind Marsh in terms of scoring rate however, his strike rate of 155.85 remains in the uppermost quartile of players that have faced more than 25 balls. In fact, his highest score this season of 83 came off just 47 balls at a strike rate of 176.59.

In a category you would expect Maxwell to dominate – boundary hitting – Weatherald (46) has hit more boundaries than Maxwell (39). Exactly 24.47% of deliveries Weatherald has faced this season have disappeared either to or over the rope with one scored every 4.09 balls faced. This places him third behind Brisbane Heat’s Tom Banton and Max Bryant.

Weatherald’s boundary hitting ability is on par with Maxwell, who has hit boundaries off 21.08% of deliveries he has faced with one scored every 4.74 balls faced. Furthermore, Weatherald has contributed a higher percentage of runs (24.91%) to his team’s totals than Maxwell. This demonstrates Weatherald’s, perhaps untold, value to the Strikers.

It could be argued that Maxwell’s contribution of 22.97% is less because he is in the same team as Marcus Stoinis (34.74%). Maxwell comes out to bat after Stoinis and, therefore, has less to do because Stoinis has done most of the work. However, Weatherald’s team-mate Jonathan Wells (24.83%) also rates highly which again displays that Weatherald is a valuable asset for the Strikers.

The Golden Bat award is an admirable if not gimmicky accolade intended to acknowledge the best performing batsman over the course of the Big Bash League season. However, we believe that in Twenty20 a batsman cannot be judged solely on the basis of run-scoring.

That’s why our version of the Golden Bat award takes scoring rate, boundary hitting and versatility into account as well in order to acknowledge and reflect the batsman who has been the most consistent across the tournament. And at just past halfway, those players are Glenn Maxwell and Jake Weatherald.

Leading Run-Scorers or Golden Bat Award

1.Marcus P STOINIS (Stars) – 478 (A)

2.Shaun E MARSH (Renegades) – 319 (B)

3.Glenn J MAXWELL (Stars) – 316 (A)

4.Beau J WEBSTER (Renegades) – 310 (A)

5.Mitchell R MARSH (Scorchers) – 307 (A)

Viper Cricket Most Complete Batsman
(Categories: Runs/Strike Rate/Boundary/Contribution)

=1.Glenn J MAXWELL (Stars) – A (A/B/A/A)

=1.Jake WEATHERALD (Strikers) – A (A/B/A/A)

=3.Mitchell R MARSH (Scorchers) – A (A/B/B/A)

=3.Tom BANTON (Heat) – A (B/A/A/B)

=5.Beau J WEBSTER (Renegades) – A (A/C/B/A)

=5.Chris A LYNN (Heat) – A (B/B/A/B)

=5.Liam S LIVINGSTONE (Scorchers) – A (B/B/A/B)

=5.Josh P INGLIS (Scorchers) – A (B/B/A/B)

Sheffield Shield 2019-20: Round One By The Numbers

Blog

Victoria 6-616d (Nic Maddinson 224, Tom Andrews 2-130) drew South Australia 6-671 (Tom Cooper 271, Chris Tremain 2-56)

Queensland 153 all out (Marnus Labuschagne 69, Harry Conway 5-17) & 268 all out (Joe Burns 52, Harry Conway 5-39) lost to New South Wales 9-288d (David Warner 125, Cameron Gannon 5-94) & 5-134 (Daniel Hughes 66, Michael Neser 3-42)

Western Australia 337 all out (Marcus Stoinis 61, Jackson Bird 3-51) & 9-383 (Shaun Marsh 85, Jackson Bird 5-78) drew Tasmania 397 all out (Tim Paine 121, Jhye Richardson 3-58)

An exciting opening round of the Sheffield Shield has come to a conclusion. We’ve seen great bowling spells, big partnerships and a ridiculous amount of runs have been scored across the three opening four-day matches.

Following so much action, there are plenty of numbers to be crunched before we can figure out which teams and players are hot and who is not after round one. Fair warning, terrible puns ahead…

HARRY PAVES THE CON-WAY

With six members of Australia’s Ashes touring party in action at the Gabba, it was 27-year-old Harry Conway who upstaged his star-studded teammates in New South Wales’ opening match of the 2019-20 Sheffield Shield season against the Queensland Bulls. The Blues boasted the likes of Mitchell Starc, Trent Copeland and Sean Abbott in their battery, but it was Conway who dismantled the hosts’ batting line-up in fast bowler-friendly conditions to collect 5-17 from 13 immaculate overs before repeating the feat with 5-39 from 17.5 overs in the second innings.

Conway didn’t allow the Queenslanders to free their arms at any time with the hosts not scoring off 45.9% of his overs leading to an incredible economy rate of just 1.84. The average dismissal rate in Test matches over the last 20 years is about 1.5% — that’s a wicket every 65 balls. Furthermore, 90% of all deliveries have a wicket probability value of less than 3%. Conway took a wicket with 5.4% of all deliveries he bowled and took half (50%) of New South Wales’ wickets.

Having played just 19 first-class games, Conway is aware his place in the New South Wales pecking order. However, more incredible performances like these might see him move up a few rungs in the near future. Watch this space…

harry-conway-nsw

Harry Conway celebrates with his teammates after dismissing Queensland’s Usman Khawaja // CA Digital Media

AGAR-RESSIVE INNINGS DISPLAYS LOWER ORDER IMPORTANCE

Jackson Bird was in full flight on the final day of Tasmania’s opening Sheffield Shield clash against Western Australia at the WACA Ground. Powered by Bird’s 5-78, Tasmania seemed on the verge of snaring an unlikely victory when the fast bowler dismissed Josh Inglis for 40 to leave the hosts at 9-298. Battling a hamstring injury, and with Cameron Bancroft as a runner, Joel Paris joined Ashton Agar at the crease in a desperate effort to salvage the match. And salvage they did.

Agar and Paris combined for a an 85-run 10th-wicket partnership, taking the Warriors to 9-383 before play was called off shortly before tea. Paris’ 23 not out off 53 balls frustrated the visitors while Agar scored 72.9% of the 85 runs and reached 76 not out off 111 balls, including 10 fours. While we all know that this isn’t the first time Agar has done something like this, his innings highlights the importance of lower order batting. Coming in to bat at number 8, Agar’s 96 runs for the match was more than six out of Western Australia’s top seven. Marcus Stoinis was the only Warriors player to outscore Agar.

The average batting score at the WACA Ground during this match was 31.18. This means that an average batsman would theoretically score 31 runs per innings under the same batting conditions (62 for the match). Therefore, Agar’s contribution of 96 was 33.64 runs above what an average batsman would have made. In short, that’s 33 runs Western Australia wouldn’t have scored without Agar.

Having a side that bats all the way down the order is important in ensuring a team maximises all of its potential run-scoring ability. The Australian Test team often puts this theory to the test with Pat Cummins, Mitchell Starc, Nathan Lyon, Josh Hazlewood, and before that Mitchell Johnson and Ryan Harris, frequently adding valuable runs to the team’s total. It seems that it’s becoming more and more important for bowlers to be able to bat a bit too and especially so in scenarios such as these. Bowling needs to remain a priority, but performances like these add extra value to players.

agar-paris-partnership

Ashton Agar walks off triumphantly with Joel Paris and Cameron Bancroft after securing a draw against Tasmania // CA Digital Media

SA AND VIC REACH RUN-SCORING JUNCTION

This week’s clash between Victoria and South Australia saw three batsman reach fifty, four batsmen reach one hundred and two batsman reach two hundred. Neither side could find a way to achieve a result in the drawn match, with the stupefying stalemate reflecting poorly on the curators of the lifeless Junction Oval pitch which showed no signs of final-day wear and tear. All up, 1,287 runs were scored and just 12 wickets were taken across the game’s four days.

Captains Peter Handscomb and Travis Head were unable to reach an agreement on a target for a final-day run-chase. Handscomb in particular lit a fuse by suggesting that South Australia was responsible for allowing the game to descend into a farce and making a pointed dig at the Redbacks’ poor recent first-class record after play on day three.

The net result was a scorecard that would make even the most astute cricket fan pull a double-take and thinking that Tom Cooper’s ludicrous 271 off 347 balls is perhaps some kind of typo remains a forgivable offence even now. Batting on what he conceded to be the flattest pitch he’s ever played on, Cooper was able to cash in and make the most of the Junction Oval run-fest to blast his 13th first-class century. Combining with first Alex Carey (117) and then Tom Andrews (101), Cooper was not only involved in two partnerships worth over 200, but he also compiled 41.6 percent of South Australia’s mammoth score of 6/671.

Cooper scored off 38.9% of all 347 deliveries he faced and of all those deliveries he faced, he scored a single off 23.9% of them. For comparison, teammate Alex Carey had a scoring shot percentage of 33.9%, while Tom Andrews scored off 32.7% of all the deliveries he faced. Meanwhile, Victoria’s Nic Maddinson, Marcus Harris and Will Pucovski scored off 37.2%, 35.0% and 36.7%, respectively.

Whilst more important in Twenty20 cricket, these high scoring rates highlight versatility, an outstanding ability to turn over the strike and suggests that each batsman is capable of a wide array of shots. These are valuable assets which shine through in a performance such as Tom Cooper’s that’s unlikely to be replicated any time soon either by himself, or indeed anybody else for that matter.

peter-handscomb-lights-fuse

Victorian captain Peter Handscomb made it no secret that he held South Australia responsible for allowing the game to descend into a farce // CA Digital Media

LIVIN IN A BATSMAN’S PARADISE

So we’ve just discussed how 1,287 runs were scored and just 12 wickets were taken across four days during South Australia’s opening match stalemate against Victoria. By taking a leaf out of Baseball’s book, it is possible to compare the lifeless conditions at Junction Oval with the two other venues used this week – the Gabba and the WACA.

Baseball’s Park Factor is a statistic that indicates the difference between runs scored in a team’s home and away games. Park Factor is helpful in assessing how much a specific ballpark contributes to the offensive production of a team or player and is designed to predict whether a venue is batter or pitcher “friendly”. Similar assessments are made subjectively in cricket with the differences between playing in English conditions and playing in Australia or the subcontinent the feature of many discussions.

Park Factor then, reflects the relative ease or difficulty in scoring or preventing runs at the venue which gives some context to a player’s performance. Based on the ratio of runs scored to wickets taken at each venue, our Park Factor model spits out a single value that is able to reflect both batting and bowling components. Anything higher than 100 is in favour of the batsmen, while anything lower than 100 suggests bowler-friendly conditions.

At the Gabba, for instance, neither side was able to post a score higher than 290 (granted New South Wales didn’t need to in their second innings) across their four days of cricket. A total of 843 runs for 34 wickets gives the Gabba a park factor of 42.29 which is obviously heavily in favour of the bowlers. This gives extra weight to stand-out performances such as Marnus Labuschagne’s dual-fifties, David Warner’s first innings century and Daniel Hughes’ match-winning 66 because they were scored in conditions conducive to fast-bowling and where the average batting score was just 19.98.

During the three innings played at the WACA, both Tasmania and Western Australia (twice) were able to achieve a score in excess of 300 for a total of 1,117 runs for 29 wickets. The park factor at the WACA is measured at 83.18 which also suggests bowler-friendly conditions. Unlike the Gabba however, the average batting score at the WACA was 31.18 which suggests that there was plenty of runs on offer for both sides, especially when seven batsmen were able to pass fifty.

Returning to the Junction Oval run-fest, both Victoria and South Australia were able to pass 600 as just 12 wickets fell across four days of cricket. With a total of 1,287 runs scored and just 12 wickets, the park factor at Junction Oval is 344.73. Yep… You read that right. A park factor like that suggests that the best plan of attack for bowlers is to not bowl at all because less runs would be scored that way. This alarming figure goes hand-in-hand with the venue’s average batting score of 78.69, meaning that if a batsman scored anything less than that, they’d be below average. Speaking of which…

henry-hunt-debut-75

South Australia’s Henry Hunt on his way to an impressive 75 on first-class debut // CA Digital Media

PUNCHING ABOVE AVERAGE

Brand new for the 2019-20 Sheffield Shield season is our Runs Above Average statistic. In Runs Above Average, we take park factor one step further by calculating the average batting score for each match and measuring it against the total runs of each batsman to see how well they performed given the conditions they batted in. The formula for the average batting is as follows:

(Total Runs Scored at Venue – Total Number of Sundries) / Total Number of Batsmen*

*Note that this is the number of batsmen who played an innings, not the number of wickets taken e.g. If a side gets bowled out, the total number of batsmen is 11. If the bowling side takes 6 wickets and 2 batsmen remain not out, the total number of batsmen is 8.

As mentioned above, we calculated the average batting score for the Gabba (19.98), the WACA (31.18) and Junction Oval (78.69). These figures are the expected number of runs a batsman will score per innings. We used this formula earlier to calculate that Ashton Agar’s total contribution of 96 runs was 33.64 runs above what an average batsman would have made. This means that Western Australia scored 33 runs more than what they would have if they didn’t have Agar.

Such a low average batting score at the Gabba means that from two innings, David Warner (125) scored 85.04 runs above the expected number of runs for the match. Queensland’s Marnus Labuschagne’s dual-fifties – equaling 121 – was 81.04 runs above the average. In conditions better suited to bowling, Warner and Labuschagne’s figures highlight how valuable their performances were to each of their respective teams. On the flip side, Steve Smith’s false start to the season (0 & 21) saw the former Australian captain score 18.96 runs below the average. Teammate Moises Henriques (-31.96) was the lowest of the New South Wales batsmen while Charlie Hemphrey (-30.96) was the lowest for Queensland.

In the west, Tim Paine’s second ever first-class century was enough to see him score 89.82 runs above the average while Western Australia’s Marcus Stoinis was 55.64 runs above the average courtesy of a pair of fifties. Having made just 44 runs at an average of 11.00 in the 2019 Ashes series, Cameron Bancroft’s 30 and second-innings duck put him 32.36 runs below the average. Fellow opener Sam Whiteman (0 & 16) was also 46.36 runs below the average making the pair the least-prolific opening partnership this season.

Finally, the flat pitch at Junction Oval was good news for South Australia’s Tom Cooper (+192.31), Alex Carey (+38.31) and Tom Andrews (+22.31), as well as Victoria’s Nic Maddinson (+145.31), Marcus Harris (+37.31) and Will Pucovski (+44.31) who all finished miles above the average. However, such a high average batting score leaves half-centurions Henry Hunt (-3.69), Travis Head (-27.69) and Aaron Finch (-21.69) well below the average.

The 2019-20 Sheffield Shield season continues on 18 October where the players, in particular batsmen, will have another opportunity to impress selectors ahead of the upcoming Test series against Pakistan in November.

Big Bash League: Round 2 by the numbers

Blog

The matches keep coming as we dive headfirst into the second round of the 2018-19 Big Bash League season. The tournament continues to be a source of entertainment over the Christmas holidays and provides a stark contrast against the Boxing Day Test in Melbourne.

It is at this point where we start to see which players are in red hot form and which are not at this early stage. With that in mind, here are just five new statistics we are using to evaluate each team’s 18 players:

1) Boundary Rate

Boundary Rate, or balls per boundary, gives us an indication of how often batsman are finding the fence. It allows us to separate monster boundary hitters, such as Chris Lynn, from those who are not regular boundary scorers.

Interestingly enough, as it stands Lynn ranks just 25th on our list of top boundary hitters this season. After struggling to find the rope often at Metricon Stadium, the powerful Queenslander is hitting a boundary every 6.3 balls.

The batsmen at the top of the list are not who you expect, but there is a reason for that. Afghanistan’s Rashid Khan seemingly can do no wrong with ball or bat and tops our boundary rate rankings scoring a boundary every 3 deliveries after hitting two fours and two sixes in Adelaide Strikers’s meagre 88 against Perth Scorchers.

Next on the list is Sydney Thunder fast bowler Daniel Sams with 4 and Brisbane Heat opener Max Bryant with 4.3. Englishman Jos Buttler sits fourth on the list of top run-scorers this season and it is clear from looking at his boundary rate of 4.4 that he is also scoring his runs rapidly. Following a 63 against the Sydney Sixers, Buttler will definitely be one to watch as the tournament progresses.

jos-buttler-63-sixers

Englishman Jos Buttler is hitting a boundary every 4.4 balls this season // Herald Sun

2) Bowler Control Index

One of methods baseball analysts use to measure a pitcher’s ability is the power finesse ratio. The power finesse ratio estimates the number of times the pitcher rather than the batter influences the outcome of an at-bat. Therefore, the Bowler Control Index (BCI) calculates the percentage of bowler-controlled deliveries out of the total number of balls bowled.

It should come as no surprise then, that the bowler in control of the majority of their deliveries is Adelaide Strikers’ Rashid Khan (65.3%). What you may not have realised is that David Willey (60) ranks second highest followed by the always economical Peter Siddle (58.3). Stephen O’Keefe (52), Jason Behrendorff (51.4) and Billy Stanlake (50) round out the top six.

If these are the bowlers with the most control, then who are the bowlers with the least control? Interestingly, spin bowlers have less control. Part-timers Ashton Turner (0) and Glenn Maxwell (11.1) rank lowest followed by the Sydney Sixers’ Lloyd Pope (13.3). Ashton Agar and Michael Beer (both 16.7) complete the bottom five.

3) High and Low Conceding Overs

Another statistic being measured by us this season is the number of runs scored off each of the bowlers’ overs. Specifically, how many overs where less than three runs were scored, how many overs where more than six runs were scored and how many overs where more than ten runs were conceded. Used in conjunction with a bowler’s economy rate, this can be used to further analyse how successful a bowler has been at defending runs.

The bowlers with the most overs where less than three runs were scored are Rashid Khan and Jason Behrendorff (both 4). While Khan’s economy rate is better than Behrendorff (3.42 to Behrendorff’s 5.08), the fast bowler is the only player in the tournament to have bowled consecutive overs of less than three runs… Twice.

Stephen O’Keefe (3) also has an economy rate below six as has Jhye Richardson (2) after his incredible spell of 3 for 7 against Adelaide Strikers. Melbourne Renegades’ Jack Wildermuth (2) has bowled the most less than three run overs with an economy over 6.

On the flip side, Michael Neser (6), Tom Curran and Ben Cutting (both 5) have bowled the most overs where more than six runs were scored. Meanwhile, Billy Stanlake has conceded more than ten runs off an over on 6 occasions. That is half of Stanlake’s overs bowled in the tournament so far.

4) Team Wicket Percentage

An adage used in games and military combat states that “the best defence is a good offence”. This is especially true in the case of the bowlers in the Big Bash League. The ability for teams to take wickets and bowl opposition sides out is a crucial skill. It’s why the Perth Scorchers have been so dominant in the early years of the competition and it was a critical part of the Adelaide Strikers’ title-winning season last year.

At this point in the 2018-19 edition of the Big Bash League, the team that has done this most successfully is the Sydney Sixers. The Sixers have taken 85% of all available wickets this season at a strike rate of 14.2. Sydney Thunder have a better strike rate of just 11.2 but, have only taken 75% of available wickets. Hobart Hurricanes and Melbourne Renegades have also taken 75% of available wickets with strike rates over 15.

Whilst early days just yet, each team’s wicket percentage will become important as the tournament goes on when it becomes critical for teams to close out tight matches.

image

Sydney Sixers have taken 85% of all available wickets this season at a strike rate of 14.2 // AAP/Steve Christo

5) Net Contribution

Finally, net contribution is being used by us this season to measure a player’s defensive liabilities against offensive output. So far, this statistic has been used as an essential evaluation tool for wicketkeepers, especially in an age where pure glovemen are being cast aside in favour of specialist batsmen who can keep a bit. Net contribution is calculated on a match basis rather than an innings basis because there may be occasions where wicketkeepers don’t bat.

The most productive wicketkeeper so far has been Sydney Thunder’s Jos Buttler. With scores of 20 and 63 in his opening matches and no byes or dropped catches conceded, Buttler has contributed 41.5 runs per match to the Thunder. Alex Carey’s scores of 70, 5 and 11 with one run cost as the result of an overthrow puts him second with 28.3 runs contributed per match.

The worst offender with the gloves this season has been Matthew Wade of the Hobart Hurricanes. Wade’s half-century against the Melbourne Stars put him back into positive figures at least, but a dropped catch off Ben Cutting cost his side an extra 55 runs. This means that, Wade has contributed just 1 run per match.

Although this statistic is only being used to measure wicketkeepers at the moment, there is no reason why it can’t be applied to the other nine fielders. Melbourne Stars’ Nick Larkin has been impressive with the bat scoring 28 and 45 in his first two innings this season. However, Larkin has now dropped three catches this season costing the Stars a total of 71 runs. Just like Wade, Larkin has contributed just 1 run per match to his team.

nick-larkin-drop-gif

Nick Larkin drops his third catch of the summer, this time against the Hobart Hurricanes.

Big Bash League: Round 1 by the numbers

Blog

The Big Bash League is back! The first five matches of the 2018-19 edition have already lived up to the hype with big hits, destructive bowling, great catches, confusing run outs and, unfortunately, rain.

As with all the entertainment the BBL provides, there are plenty of numbers to be crunched to figure out which teams and players are hot and who is not after round one. Here are some of the things we learned from the opening round of BBL|08:

1) Batting Second isn’t always the answer

Prior to the invention of Twenty20 cricket, it was a firmly held belief by captains that should you win the toss, you should elect to bat first. In fact, an old observation by former Australian captain Ian Chappell says that “when you win the toss, you bat first nine times out of ten; the tenth time you think about it and bat first anyway”.

Chappell’s statement seems to have been inverted in recent seasons of the BBL with most franchise captains believing that batting second i.e. chasing, results in more wins, more often. In BBL|06 for example, twenty-seven out of 34 teams that won the toss opted to bowl. The seven who decided to bat first all regretted it, losing every single time.

However after the first five matches this season, three teams have won the match having batted first. The proportion of wins batting first to batting second sits at a 60-40 per cent split, respectively.

What’s more interesting to note is that only Moises Henriques of the Sydney Sixers elected to bat first. The other two teams – Sydney Thunder and Hobart Hurricanes – were both sent in to bat by the opposition captain.

It’s safe to assume that for now teams and captains will continue to send their opponents in to bat first, but it’s clear that setting a decent score and subsequently defending it is not a bizarre notion.

chris-lynn-dismissed

Chris Lynn’s whirlwind cameo of 33 came to abrupt end courtesy of Peter Siddle // AAP, ‘Gabba

2) Catches really do win matches

It’s one of the oldest adages in the cricket playbook. Catches win matches. In the first five matches played, this statement has been proven true on multiple occasions.

Jake Lehmann was lucky in the sense that when he dropped Brisbane Heat’s Max Bryant in the tenth over of the tournament opener at the ‘Gabba, the 17-year-old was caught by Rashid Khan the following delivery.

Ironically, it was Bryant himself who was less fortunate when he grassed an opportunity off the bat of Jake Weatherald when the opener was on just 1.

Weatherald added just 16 more runs to his overall tally, which may not seem like much. However when you consider that the Heat bowlers took the run chase to the final over, an additional 16 runs may have been too big a mountain for the defending champions to climb.

Another example was Ashton Agar’s dropped catch of Jordan Silk at the Sydney Cricket Ground. Agar dropped a simple return catch in the ninth over when Silk was on just 17. Silk went on to score 67 not out, a net cost of 50 runs, as part of a 124-run stand with Daniel Hughes that proved to be the difference between Sydney Sixers and Perth Scorchers.

Oddly, the highest net cost of the tournament so far – 55 runs – was still not enough for Brisbane Heat to overcome Hobart Hurricanes on the Gold Coast. Matthew Wade grassed a chance gloved by Ben Cutting down the leg side when the Heat all-rounder was on 3. Cutting went on to score his maiden BBL fifty and nearly proved the difference between the two teams.

3) Melbourne Stars are the worst offenders in the field

Melbourne Stars finished at the bottom of the ladder in the competition last season. It can be assumed that people weren’t expecting miracles from the relatively inexperienced team. At this point, there have been twelve catches dropped in the field. The Stars dropped three catches against their green shirt-wearing counterpart – Sydney Thunder – in Canberra.

Not only that, but it was Sydney Thunder’s Daniel Sams that survived all three opportunities. Adding to the woes was the fact that two of the three were dropped by the same person. Nick Larkin had two opportunities to dismiss Sams at long on each within an over of each other.

The first was in the air for a long time, but Larkin didn’t sprint in and was forced to vainly dive full length to try and catch it. He also misjudged the second chance and ran in a touch too far before jumping up with one hand only for the ball to burst through and reach the boundary. Larkin actually had an extra two or three metres behind him he could have used.

Larkin wasn’t the only Stars player struggling in the field. We observed Marcus Stoinis mis-field the ball three times, costing his side three runs. He was able to save one run later in the evening to earn back some respect.

Elsewhere, Jackson Coleman also mis-fielded the final delivery of Michael Beer’s opening over. Hit powerfully by Shane Watson, Coleman missed the ball at mid off and it raced to the boundary, costing his side four runs. In his defence, he got an awkward bounce that went straight through him.

nick-larkin-dropped-catch

Nick Larkin misjudges a second chance and has to jump up with one hand // Channel Seven

4) Relying on one batsman’s contributions will not win matches

Cricket already has numerous metrics which can be used to evaluate a batsman’s performances. Offensive rating systems that are designed to provide a better insight into a batsman’s ability can be found everywhere as different ways to evaluate players. In this way, it is implied that any batsman can be maniplulated to look better than they are depending on the rating system used.

One of the most relevant offensive rating systems, we believe, is the percentage of completed innings. This statistic provides us with the percentage of runs a player scores out of the team’s total. Using this, we can determine the players who are of the most value to their respective sides when compared to players from other teams.

Adelaide Strikers made 147 runs in their chase of Brisbane Heat’s meagre 146. Wicketkeeper Alex Carey scored 70 runs off 46 balls striking at 152.17. Anyone can see that Carey’s contribution proved to be the difference between the two teams however, his 70 runs equates to 49.3% of the Strikers’ final tally. That’s nearly half.

This highlights Carey’s importance to the Strikers’ batting order and poses a problem for the rest of the Strikers’ batsmen should Carey be selected for the upcoming ODI series against India beginning on 12 January.

D’Arcy Short was another batsman to score a half-century during the first five matches, also against Brisbane. Short’s 67 off 52 equates to 45.6% of the Hurricanes’ final score of 159. There’s no doubt that Short will also be in the frame for ODI selection. The second-highest contribution for the Hurricanes was 17% courtesy of Ben McDermott and his 25 off 16.

Sydney Thunder scored 181 runs off their 20 overs against Melbourne Stars, the highest of the tournament so far. Jason Sangha and Daniel Sams contributed 36.4 and 19.7 per cent of their team’s total, respectively, during their 77-run partnership in Canberra. That may be less than Carey and Short, but they also had valuable help from their team-mates.

Shane Watson contributed 12.7 per cent at the top of the order with Englishmen Jos Buttler and Joe Root contributing 11.6 and 10.4 per cent, respectively. Therefore, Sydney Thunder batted the best as one cohesive unit, as opposed to the Strikers and Hurricanes who relied heavily on individual performances of their players. This is going to be an important factor when it comes to crunch time later in the season.

d'arcy-short-contribution

D’Arcy Short contributed 45.6% of Hobart Hurricanes’ total of 159 against Brisbane Heat // AAP

5) Scoring consistently earns big runs

For a team called the Sixers, the Sydney-based franchise achieved this feat just three times during their opening match against the Perth Scorchers at Sydney Cricket Ground.

That being said, Daniel Hughes and Jordan Silk’s 124-run partnership was not only critical to the team’s success, but it was also scored at an incredibly fast rate. Hughes’ strike rate of 140.91 was fractionally better than Silk’s 136.73 and the pair were both striking quicker than the team’s overall strike rate of 133.33, but these numbers only tell half the story.

Hughes faced 44 balls on his way to 62 and scored at least one run off 34 of them. That’s 77.3%. His team-mate Jordan Silk was even better and scored off 43 out of his 49 balls faced during his innings of 67 not out. Silk’s scoring shot percentage of 87.8% is the highest out of any players in the league that have faced at least 10 deliveries at this point.

By comparison, Alex Carey scored off 67.4% of his deliveries faced during his innings of 70 against Brisbane Heat, Jason Sangha scored off 77.8% and Daniel Sams scored off 80.9% against Melbourne Stars. Melbourne Stars’ Nick Larkin is the next closest to Silk, scoring off 84.6% of his deliveries faced during his innings of 28 against Sydney Thunder in the rain-reduced match at Manuka Oval.

Sydney Sixers may have only hit three sixes this season however, the team’s scoring shot percentage of 77.5% is also significantly greater than any other team in the league. It’s a wonder why the Sixers are so often overlooked simply because they lack “big name” players. If the Sixers continue this scoring rate, they may yet become a dark horse when teams begin the scramble for a finals berth.

6) Dropped catches are costly, but can also be very odd

Cricket statistics can not only tell us which players are scoring quickly or taking the most wickets. They can, at times, be very odd. This BBL season, we have been tracking a range of factors around dropped catches such as who has dropped a catch, where they were fielding, what stage or over of the match and what the batsman’s score was when they were dropped.

We mentioned before how Ashton Agar dropped a return catch off Jordan Silk when the latter was on just 17. D’Arcy Short was also survived a caught and bowled chance during his innings against Brisbane Heat. Short came skipping down the ground and smashed the ball right past Mitchell Swepson’s left. While it may have been too difficult a chance for Swepson to grip, surviving a caught and bowled chance is not the only thing Silk and Short have in common.

Both were dropped in the ninth over with each their respective teams at least two wickets down for 56 runs. Furthermore, both players went on to score 67, each of their teams set their opponents a target of at least 160 runs and went on to win the game by at least 15 runs.

That may not be interesting, relevant, or more importantly that funny to some, but it certainly is peculiar. The truth really is more strange than fiction.

Australia v India: Wicket Probability – Day 2

Blog

During a brutal afternoon, when temperatures spiked above 38°C, Australia’s besieged batters found runs hard to come by. Without a run on the sheet, and having survived a shout for lbw the previous delivery, opener Aaron Finch aimed to hit an expansive cover drive, but only managed to inside edge the ball into his stumps.

That set the tone for the rest of Australia’s innings. Debutant Marcus Harris appeared composed and worked hard to score 26 runs. Usman Khawaja worked even harder, taking 135 balls to reach 28—the slowest scoring rate of his Test career to this point—before he also succumbed to Ravichandran Ashwin, gloving a ball through to the keeper.

With Shaun Marsh out for 2 and Australia at 4-87, the home side could only take comfort knowing they were still in better shape than were India a day earlier.

With just 15 Test matches between them, Australia’s last specialist batting pair of Peter Handscomb and Travis Head mounted a comeback. Handscomb looked solid and scored five boundaries during his 34, while Head remains 61 not out at stumps.

Australia’s woes were kickstarted early on by tight defensive bowling by India’s seamers. India’s pace attack of Ishant Sharma, Jasprit Bumrah and Mohammed Shami bowled with discipline and kept run-scoring to a minimum.

The paceman were given plenty of support by the always reliable Ashwin. The off-spinner bowled 22 overs on the trot during the middle session of play. The quartet worked well to make their team’s first innings total of 250 look imposing.

The unique computer model used by CricViz enables the prediction of match outcomes, the interpretation of team and player performance and the anticipation of what is likely to happen next.

In September 2018, CricViz rolled out their brand new Wicket Probability model. The aim of the model is to estimate the probability of a specific delivery resulting in a dismissal of the batsman.

The model takes into account a range of different aspects and characteristics of a delivery which CricViz gets from official ball-tracking providers including bowler type, left/right-handedness, batting position, release speed, line, length, amount of swing and deviation of the ball off the pitch.

aaron-finch-dismissal

Ishant Sharma made a mess of Aaron Finch’s stumps with the third delivery of the innings // AAP

The output from the model tells us something which, in hindsight, should be pretty obvious and that is that wickets are pretty rare. In fact, the average dismissal rate in Test matches over the last 20 years is about 1.5%. In terms of bowling strike rate, that’s a wicket every 65 balls. 90% of all deliveries have a wicket probability value of less than 3%.

CricViz’s Wicket Probability model was rolled out just in time for it to be used during the Indian cricket tour of England in September. In that series, the aggregate strike rate was 50.9 balls per dismissal—the second lowest in any season of Test cricket in England since 1907.

Analysis of tracking-only Wicket Probability suggests that a significant reason for this decline was the level of batting difficulty. The wicket probability in 2018 of 1.97% is the highest recorded by CricViz ball-tracking database which began in 2006.

A wicket probability of 1.97% means that in strike rate terms we would expect a wicket to fall every 50.8 deliveries (100 divided by 1.97), eerily close to the actual aggregate strike rate of 50.9. This suggests that the batsmen performed at a typical level given the English conditions and the quality of the bowling rather than declining in batting standards.

Given the similarity between the aggregate strike rate and the results of the CricViz Wicket Probability model, it is possible for us to estimate a Wicket Probability for the First Test in Adelaide using the above formula.

India were bowled out for 250 after 88 overs in their first innings. That means the Australians bowled 528 legal deliveries to the away side, giving them a strike rate of 52.80. Therefore, Australia had an approximate Wicket Probability of 1.89% during the first innings.

So far, Australia has also faced 88 overs. Their stumps score of 7–191 after facing 528 legal deliveries, plus two no-balls, gives the Indian team a bowling strike rate of 75.71. Interestingly, this means that India (so far) has an approximate Wicket Probability of just 1.32%.

These numbers are made all the more intriguing when you consider that 2018 has been India’s most-prolific in terms of wickets taken. India have taken 134 wickets from 12 matches in 2018 at a strike rate of 47.7. It’s their best since 1979 when a team featuring Kapil Dev took 125 wickets from 17 matches at a strike rate of 61.8.

So, why is India’s Wicket Probability higher than Australia’s when their bowling was as disciplined as it was?

For starters, there is the sheer number of deliveries faced by each of Australia’s batsmen today. Of course, Cheteshwar Pujara’s dogged 246 balls spent at the crease was the backbone of India’s innings, but Pujara’s innings lasted 170 balls longer than the next highest (Ashwin’s 76-ball 25). The Indian team had a combined batting strike rate of 47.35.

By contrast, five of Australia’s batsmen spent more than 45 balls at the crease (Harris, Khawaja, Handscomb, Head and Cummins). Australia’s captain Tim Paine spent 20 balls at the crease before edging through to the keeper for 5 and Shaun Marsh lasted one ball less in his score of 2 striking at just 10.52.

Truthfully, if Australia had scored the same amount of runs as deliveries they faced, India would be staring down the barrel of an innings defeat. Instead, Australia’s meagre batting strike rate of 36.04 proves how successful India’s bowlers have been at minimising run-scoring.

Another reason that India’s Wicket Probability is lower than Australia’s could be down to India’s length. India bowled a generally shorter length to the Australian batsmen compared to Australia’s bowlers yesterday. The below pitch map provides an example of the line and length India’s fast bowlers aimed at Peter Handscomb:

indian-seamers-peter-handscomb

This pitch map displays the lines and lengths the Indian seamers bowled to Peter Handscomb // BCS Stats

Looking at the pitch map we can see that just 16% of the deliveries Peter Handscomb faced would have gone on to hit the stumps. Bowling these lines and lengths means that even if Handscomb wasn’t standing at the crease, India would still miss the stumps 84% of the time.

Perhaps ironically, Handscomb eventually succumbed trying to late cut a delivery well outside off but despite this, it seems that the Indian seamers were content enough with just drying up the runs and allowing off-spinner Ashwin to do most of the damage at the other end.

They say that pressure at one end gets wickets at the other and Ashwin’s return of 3–50 off 33 overs seems to support this theory. In fact, Ashwin bowled the majority of India’s overs—37.5% to be exact. That being said, it was his tight bowling, which yielded nine maidens and an economy rate of just 1.51, that applied the brakes on Australia’s top order featuring many batsmen that pride themselves on scoring freely.

Australia needs just 59 runs tomorrow to pull level with India’s first innings total, but there is still a big mountain to climb. The hosts have just three wickets in hand and the nation’s hopes now rest in a man playing just his third Test match.

Can South Australia’s youngest Sheffield Shield captain help Australia dig its way out of a hole? Or will India’s bowlers continue their dominant display? Travis Head continues Australia’s rescue mission when play resumes tomorrow morning.

FACTS & FIGURES

  • Aaron Finch has made his lowest Test score in every innings he has played.
  • Usman Khawaja’s strike rate of 22.40 is his lowest ever in Test cricket.
  • Shaun Marsh became the first Australian top-five batsman since 1888 to be dismissed for single figures in six consecutive Test matches. It was also the 5th time Marsh has been dismissed by Ravichandran Ashwin in 18 encounters.
  • This was Travis Head’s 2nd fifty in 3 Tests and his 1st against India. It was also his first in Australia.

Australia v India: Batsmen v Bowlers – Day 1

Blog

Amid all the debate surrounding Australia’s batting order in the wake of the sandpaper controversy, you could almost be forgiven if you forgot about the efficiency of the Test team’s bowling line-up.

It’s been less than 12 months since Mitchell Starc, Josh Hazlewood, Pat Cummins and Nathan Lyon dismantled a much-fancied England side to regain the Ashes. It shouldn’t have come as much of a surprise that, Cheteshwar Pujara’s 246-ball 123 aside, the Australian bowlers took 8-127 on Day 1 of the First Test in Adelaide.

India won the toss and Virat Kohli confidently elected to bat first on a flat track, consigning Australia to the field for the day in 39°C heat. The coin toss was the only thing that swung India’s way in the opening session with Josh Hazlewood removing Lokesh Rahul with the last ball of the 2nd over.

After a solitary session, India’s scorecard read like so many others from their 11 previous ventures to Australia since 1947. The visiting side were 4-56 at the lunch break with all four top order wickets falling to catches behind the wicket from unnecessary drives away from the body.

One of the most talked about aspects of cricket is the ongoing mental battle between batsman and bowler. The bowler is proactively trying to make something happen in order to take a wicket, whereas the batsman is more reactive in knowing which shots to play and when they should be played.

Following the opening day of the First Test, we collated all of the ball-by-ball data from the day’s play to track how each batsman fared against each of Australia’s bowlers. All of the data from today is collated below and some of the results make for interesting reading. It was exactly this kind of data that became relevant with the dismissal of Virat Kohli.

Murali Vijay joined his opening partner Rahul in the sheds for just 11, leaving the away side reeling at 2-15. Indian captain Kohli was out in the middle earlier than he would’ve liked, but he still batted with precision and scored 3 off his first 13 balls. Then, Patrick Cummins came into the attack.

Staggeringly, Cummins had only ever bowled one delivery to Kohli in Test cricket to this point. This was at Ranchi back in March 2017. On that particular occasion, Kohli played a loose drive at a wide half-volley. With no feet movement, the Indian skipper was only successful in edging the ball to Steve Smith at second slip. One ball. One wicket.

Today, Cummins’ first ball was defended by Kohli back towards short mid-on. The second delivery was driven firmly straight to mid-off. Then, the big moment. Kohli couldn’t resist the temptation to drive Cummins’ third ball. Pushing hard at the delivery, the ball flew off the edge where Usman Khawaja put out a full stretch dive to his left to pluck a screamer out the air. Cummins versus Kohli in Test cricket, 1-0 off just 4 balls.

cummins-versus-kohli

A pitch map displaying the four deliveries that Pat Cummins has delivered to Virat Kohli in Test cricket // BCS Stats

It is also interesting to note that since India’s last tour of Australia, Kohli has scored just 49 runs in six Test innings against Australia. That’s an average of just 8.16 from a player who otherwise averages 54.58 in Test cricket and 62 in Australian territory.

Looking at batsman v bowler data can provide valuable insight into which batsmen favoured which bowlers and vice versa. For example, Josh Hazlewood took just 2 deliveries to draw a false shot from opener Lokesh Rahul. Hazlewood’s first ball to Rahul, the fifth of the over, went sliding down leg before he enticed a loose drive from Rahul on the next ball that was edged through to Aaron Finch at third slip.

Similarly, Anjinkya Rahane was dismissed by Hazlewood with the first ball he faced from the tall fast bowler, also an edge off a full and wide delivery that this time flew to Peter Handscomb at second slip.

The data also suggests that Rohit Sharma struggled against Hazlewood with India’s number six scoring just 4 of his 37 runs off Hazlewood’s bowling from the 17 deliveries he faced.

It seems Hazlewood was the pick of the Australian bowlers then with the New South Welshman claiming 2-52 from 19.5 overs including 3 maidens. The pitch map below gives us a true indication of Hazlewood’s probing line and length and further explains India’s struggles against the big quick:

image

This pitch map clearly displays Josh Hazlewood’s probing line and length against India on Day 1 // BCS Stats

Rohit took more of a liking to Pat Cummins’ bowling instead. The swashbuckling right-hander hit 18 runs from 21 balls including one four and two sixes at a strike rate of 85.71 against the paceman. Rohit’s three boundaries against Cummins equates to a boundary percentage 14.3% or one boundary every seven Cummins deliveries.

Despite the dogged century posted by Cheteshwar Pujara—the only member of India’s current big five batters not to have previously registered a Test ton in Australia—it seems Cummins had better fortune bowling to him.

In Pujara’s mammoth 246-ball century, he scored 32 runs off Mitchell Starc (26%), 35 runs off Hazlewood (28%) and 43 runs off Nathan Lyon (35%). However, Pujara scored just 12 runs from 40 deliveries bowled to him by Cummins, or 10 per cent.

Pujara’s 123 was an integral part in ensuring that India reached a total higher than 200. In fact, Pujara scored no less than 49.2% of India’s stumps score of 9-250. Almost half of India’s runs came courtesy of just one batsman. Pujara batted with 8 different partners and remained on the field for 85.4 overs.

Comparison
CA Pujara: 1-123 (41 overs)
India: 8-127 (46.4 overs)

The visitors’ stumps score of 9-250 could have proved to be a distant dream if not for Pujara’s efforts. India would have been hoping for Pujara to continue his innings tomorrow and guide the team to a final total in excess of 300.

Ironically, it was Pat Cummins that eventually removed Pujara on what proved to be the final ball of the day’s play, but not with ball in hand. As Pujara hurried through for a quick single, Cummins somehow threw down the stumps at the non-strikers end from side-on while levitating in mid-air to end a weary Pujara’s innings on 123.

India went to stumps on day one with a score of 9-250 with Mohammed Shami on 6 runs set to joined by Jasprit Bumrah when play resumes tomorrow morning.

BATSMEN V BOWLERS DATA

India
KL Rahul v Starc: 2 off 6, Hazlewood: 1-0 off 2
M Vijay v Starc: 1-3 off 8, Hazlewood: 8 off 14
CA Pujara v Starc: 32 off 52, Hazlewood: 35 off 66, Cummins: 12 off 40, Lyon: 43 off 80, Head: 1 off 8
V Kohli v Starc: 1 off 6, Hazlewood: 2 off 7, Cummins: 1-0 off 3
AM Rahane v Hazlewood: 1-0 off 1, Cummins: 5 off 18, Lyon: 8 off 12
RG Sharma v Starc: 2 off 9, Hazlewood: 4 off 17, Cummins: 18 off 21, Lyon: 1-13 off 14
RR Pant v Starc: 16 off 12, Cummins: 5 off 16, Lyon: 1-4 off 10
R Ashwin v Starc: 2 off 8, Hazlewood: 2 off 7, Cummins: 1-9 off 15, Lyon: 11 off 42, Head: 1 off 4
I Sharma v Starc: 1-0 off 8, Hazlewood: 0 off 1, Cummins: 0 off 1, Lyon: 4 off 10
Mohammed Shami v Starc: 5 off 5, Hazlewood: 1 off 4

FACTS & FIGURES

  • Mitchell Starc’s fastest delivery was recorded at 151.4 km/h.
  • This was Cheteshwar Pujara’s 16th hundred in 65 Tests and his 3rd against Australia.
  • Marcus Harris became the 456th man to play Test cricket for Australia. His baggy green was presented by Michael Hussey.
  • Cheteshwar Pujara’s innings contained 180 dot balls totalling 73.2% of all deliveries he faced.
  • Ishant Sharma scored from just one of the 20 balls he faced.
  • Rohit Sharma contributed 82.22% of the runs during his partnership with Cheteshwar Pujara.
  • India’s highest partnership of 62 runs was that of Cheteshwar Pujara (37) and Ravichandran Ashwin (25).

Bolt Rate: The potential significance of a gimmick statistic

Blog

In November 2017, Gatorade partnered with Olympic gold medallist Usain Bolt to launch a new measurement for recording cricket players’ run speed between wickets. Dubbed the ‘Bolt Rate’, this integrated campaign by Eleven and TBWA was designed to measure player speeds using Catapult GPS tracking technology, the official technology used by Cricket Australia.

The Bolt Rate was designed to record the players’ run speed between wickets during the 2017-18 summer of cricket with the fastest man being crowned with The Gatorade Fastest Run trophy.

Bolt himself worked alongside Cricket Australia and Gatorade, providing pointers to the Australian men’s team in order to give them a speed advantage between the wickets.

General Manager of Eleven Fiona Milliken said: “Australia is a nation of avid cricket fans and we tapped into their competitive spirit to create an innovative new way to talk about a sport with a long, proud heritage. The Bolt Rate brings speed to the game and has created a new dialogue for cricket fans.”

Riiiiight.

Anyone can see that this was nothing more than a sponsor-driven gimmick designed to advertise and sell sports-themed beverages, for profit no less. However, there may yet be some method to the madness.

The sprint speeds achieved by cricketers during matches have never been measured before which actually makes the Bolt Rate a very intriguing statistical measurement. Not only that, but measuring players’ speeds between the wickets is only the tip of an iceberg full of potential. GPS tracking systems could be used to measure the sprint speed of players in the outfield. In fact, they already are.

The Australian national cricket team use personal GPS systems on their players during matches to measure sprint speed, distances travelled, heart rates and the number of sprint efforts made through the day. It seems however, that these figures and kept under lock-and-key by Cricket Australia. They are seldom published.

However, the data recorded by the GPS system worn by Mitchell Johnson at the 2013-14 Boxing Day Test can be sourced and it makes for some interesting reading. On the opening day of the Test, Johnson covered a total distance of 23 kilometres including 144 sprints.

Channel Nine cricket high performance analyst Jock Campbell was the man who collated the data from the GPS unit worn by Johnson at the MCG.

“The MCG is probably the biggest ground they play on in Australia so there’s a lot more distance they cover during the day,” said Campbell. “The fast bowlers always travel the farthest and Mitch did 23 kilometres on the first day.”

“People say that’s it’s stop-start and he walks part of it and that’s great, but go and walk for 23 kilometres and tell me how tired you are at the end of it and try to bowl fast in the middle of it.

“It’s further than a half-marathon and he’s got to back up the next day and bowl fast again and try to get wickets.

“It just shows the endurance and athleticism of these fast bowlers, particularly the Australians. They tend to do more off-the-ball running—backing up throws and support play of the fieldsmen when they’re chasing balls.”

While chasing a ball through the outfield, Johnson also reached a top speed of 33.1 km/h, the fastest pace recorded by Campbell at that stage of the season.

“In previous years Mike Hussey’s done 35 km/h, Peter Siddle’s got up to 35.9 km/h and Brett Lee’s been the fastest one we’ve recorded so far, just over 36 km/h, and that’s faster than most rugby league wingers, fast guys in the AFL, or fast wingers in rugby union that get recorded,” said Campbell.

“What it demonstrates is that cricketers in the field chase over long distances, 50, 60, even 80 metres, so they’ve got to be conditioned to do that.”

mitchell-johnson-fielding

Mitchell Johnson fielding during a tour match against Northamptonshire during the 2009 Ashes // Chris Brown

Indeed it does. So if Cricket Australia believes it is important enough to record this kind of data, why don’t we?

Obviously, Cricket Australia does it for strength and conditioning purposes. They monitor the players during a match to ensure that they prepare them for the work they have to endure at training. However, there is untold value in recording player sprint speeds, distances covered and number of sprint efforts.

Major League Baseball (MLB)’s Statcast system introduced a sprint speed metric during the 2017 season with the aim to more precisely quantify speed by measuring how many feet per second a player runs in his fastest one-second window.

Approximately seven full-effort strides can be captured over the course of a one-second window, so Statcast’s sprint speed rewards those who can sustain their speed over a longer period of time. Sprint speed captures top running speed both on the bases and in the field. Measuring the sprint speed of fielders makes it possible to assess their speed to the ball.

Byron Buxton, one of the fastest players in the MLB achieved a sprint speed of 30.2 ft/sec (9.2 m/s) in 2017. The average sprint speed across the league was 27 ft/sec (8.23 m/s). For comparison, Johnson’s 33.1 km/h effort equates to 9.19 m/s, placing him above the average MLB player. It also means that if he and Buxton maintained their top speeds in a 100 m sprint, Buxton would win by 0.01 secs.

By using GPS units on players, it is also possible to measure how much distance a fielder covers over the course of a match. Distance covered is an increasingly visible statistic in soccer and is particularly useful for midfielders whose contributions can’t be measured by goals and assists alone. It’s also useful for assessing a player’s hustle in winning back balls in defence, as well as in kickstarting attacks and providing service to strikers.

Measuring the distance covered by cricketers adds potential value in ODIs and T20s, where players attempt to steal singles and twos and where fielders are moved to key catching and run-saving areas at various stages. In some T20s, where more than half the side doesn’t bat, this stat can quantify the value of every player on the field.

The 23 kilometres Johnson covered on Boxing Day 2013 includes every single delivery he bowled on that day. That’s exactly 25.6 metres each time he completed his run-up. Therefore, it must be theoretically possible to measure how far fielders travelled on “competitive” plays whenever they are called upon to chase a ball through the outfield.

This can add value to players such as Jordan Silk and AB de Villiers who are often posted on the boundary towards the end of an innings. It could be possible to find value in players who cover more territory in the outfield than those who often remain in the infield.

The sports drink-sponsored Bolt Rate named Aaron Finch as the fastest man between the wickets with a top speed of 30.15 km/h (8.37 m/s) between the wickets followed by Cameron Bancroft at 26.62 km/h (7.39 m/s). The details surrounding the actual speed tests are scarce and it is assumed that the players were wearing pads and other equipment at the time of the tests to simulate a match environment.

Sprint speeds should be measured and applied to fielders in order to gain a better understanding of who the fastest players in the field are. Players should be rewarded for their ability to move quickly and cover more distance in the field. Measuring fielder sprint speeds places greater emphasis on moving quickly to the ball. It might just be the difference between catching a tough chance or completing a tight run-out opportunity.

The Journey Begins

Uncategorized

In 2002, Billy Beane, assisted by Paul DePodesta, and the Oakland Athletics front office revolutionised the way that baseball was played forever. Prior to the start of the season, Oakland saw the departure of three key players. By looking at statistics in a way no-one ever had before, Beane and his cash-strapped team responded with a series of under-the-radar free agent signings and were able to assemble one of the most dominant teams in baseball history.

The new-look Athletics, complete with a pitcher who threw sidearm, a first baseman who couldn’t throw due to nerve damage and a 36-year-old believed to be past his prime, were all systematically hand-picked by the Athletics staff to play on their team.

Despite a comparative lack of star power, the 2002 Oakland Athletics surprised the baseball world by besting the 2001 team’s regular season record by winning 103 out of 162 matches. The team is perhaps most famous for winning 20 consecutive games between August 13 and September 4, 2002. It remains the third-longest streak in MLB history.

The story of their season has been immortalised forever in Michael Lewis’s 2003 book Moneyball: The Art of Winning an Unfair Game (Lewis was given the opportunity to follow the team around throughout the season) and a 2011 film adaptation of the book, also titled Moneyball. The statistical analysis and player evaluation methods used by the 2002 Oakland Athletics are still used today in baseball.

Cricket is a bat-and-ball game very similar to baseball in many aspects. In both cricket and baseball there are batsmen, bowlers (pitchers) and fielders and both games are won by scoring more runs than the opposition team. The two sports are also unique in the sense that they are team sports with very individualised aspects to them.

What the fielders do has no impact on the type of delivery a bowler is going to bowl. Certainly the captain can tell his bowler where to bowl, but it is up to the bowler to execute and take wickets. Same with batting. Although batting with a partner at the non-striker’s end, the responsibility of scoring runs is placed firmly on the shoulders of the striking batsman.

It was in the mid-1970s that Bill James, a University of Kansas graduate of economics and literature, became obsessed with the idea of writing down his thoughts on baseball, in response to having things he absolutely needed to say that he was unable to convey any other way.

James collected his musings on baseball in a self-published 68-page book—photocopied and stapled together by himself—known as the 1977 Baseball Abstract: Featuring 18 Categories of Statistical Information That You Just Can’t Find Anywhere Else.

Just 75 people found it alluring enough to purchase via a single one-inch advertisement in The Sporting News, but repeated and expanded issues published almost yearly since eventually found their way to Paul DePodesta and later, Billy Beane. Using new statistics and mathematical formulas, which James dubbed ‘Sabermetrics’, the Athletics could analyse players in a much more in-depth way than ever done previously.

Baseball thinking was medieval. A large part of the early sabermetrics revolution showed that fielding was an overrated skill, whereas getting on base was an underrated skill.

Cricket thinking is medieval. We already mentioned how cricket is unique, but cricket is even more unique because of its three formats: Test cricket, One-Day cricket (50 overs) and Twenty20 cricket (20 overs). These distinctions are very important.

Statistics that are appropriate for evaluating players in Test cricket have no place in the shortest format of the game, Twenty20 cricket. Cricket’s youngest brother is essentially a different game to Test cricket. Test cricket relies upon batsmen scoring buckets of runs and not getting out whereas Twenty20 cricket relies upon scoring buckets of runs much quicker and hitting boundaries much more frequently.

Cricket is need of an Oakland-esque revolution. It is time for an update and Twenty20 cricket is the perfect launching pad for moving past the traditional and medieval methods of the past which spread lies about player performances to those observing.

That is the aim of this website: to weed out misleading statistics and guide you towards more in-depth assessments of cricket statistics.