
In November 2017, Gatorade partnered with Olympic gold medallist Usain Bolt to launch a new measurement for recording cricket players’ run speed between wickets. Dubbed the ‘Bolt Rate’, this integrated campaign by Eleven and TBWA was designed to measure player speeds using Catapult GPS tracking technology, the official technology used by Cricket Australia.
The Bolt Rate was designed to record the players’ run speed between wickets during the 2017-18 summer of cricket with the fastest man being crowned with The Gatorade Fastest Run trophy.
Bolt himself worked alongside Cricket Australia and Gatorade, providing pointers to the Australian men’s team in order to give them a speed advantage between the wickets.
General Manager of Eleven Fiona Milliken said: “Australia is a nation of avid cricket fans and we tapped into their competitive spirit to create an innovative new way to talk about a sport with a long, proud heritage. The Bolt Rate brings speed to the game and has created a new dialogue for cricket fans.”
Riiiiight.
Anyone can see that this was nothing more than a sponsor-driven gimmick designed to advertise and sell sports-themed beverages, for profit no less. However, there may yet be some method to the madness.
The sprint speeds achieved by cricketers during matches have never been measured before which actually makes the Bolt Rate a very intriguing statistical measurement. Not only that, but measuring players’ speeds between the wickets is only the tip of an iceberg full of potential. GPS tracking systems could be used to measure the sprint speed of players in the outfield. In fact, they already are.
The Australian national cricket team use personal GPS systems on their players during matches to measure sprint speed, distances travelled, heart rates and the number of sprint efforts made through the day. It seems however, that these figures and kept under lock-and-key by Cricket Australia. They are seldom published.
However, the data recorded by the GPS system worn by Mitchell Johnson at the 2013-14 Boxing Day Test can be sourced and it makes for some interesting reading. On the opening day of the Test, Johnson covered a total distance of 23 kilometres including 144 sprints.
Channel Nine cricket high performance analyst Jock Campbell was the man who collated the data from the GPS unit worn by Johnson at the MCG.
“The MCG is probably the biggest ground they play on in Australia so there’s a lot more distance they cover during the day,” said Campbell. “The fast bowlers always travel the farthest and Mitch did 23 kilometres on the first day.”
“People say that’s it’s stop-start and he walks part of it and that’s great, but go and walk for 23 kilometres and tell me how tired you are at the end of it and try to bowl fast in the middle of it.
“It’s further than a half-marathon and he’s got to back up the next day and bowl fast again and try to get wickets.
“It just shows the endurance and athleticism of these fast bowlers, particularly the Australians. They tend to do more off-the-ball running—backing up throws and support play of the fieldsmen when they’re chasing balls.”
While chasing a ball through the outfield, Johnson also reached a top speed of 33.1 km/h, the fastest pace recorded by Campbell at that stage of the season.
“In previous years Mike Hussey’s done 35 km/h, Peter Siddle’s got up to 35.9 km/h and Brett Lee’s been the fastest one we’ve recorded so far, just over 36 km/h, and that’s faster than most rugby league wingers, fast guys in the AFL, or fast wingers in rugby union that get recorded,” said Campbell.
“What it demonstrates is that cricketers in the field chase over long distances, 50, 60, even 80 metres, so they’ve got to be conditioned to do that.”
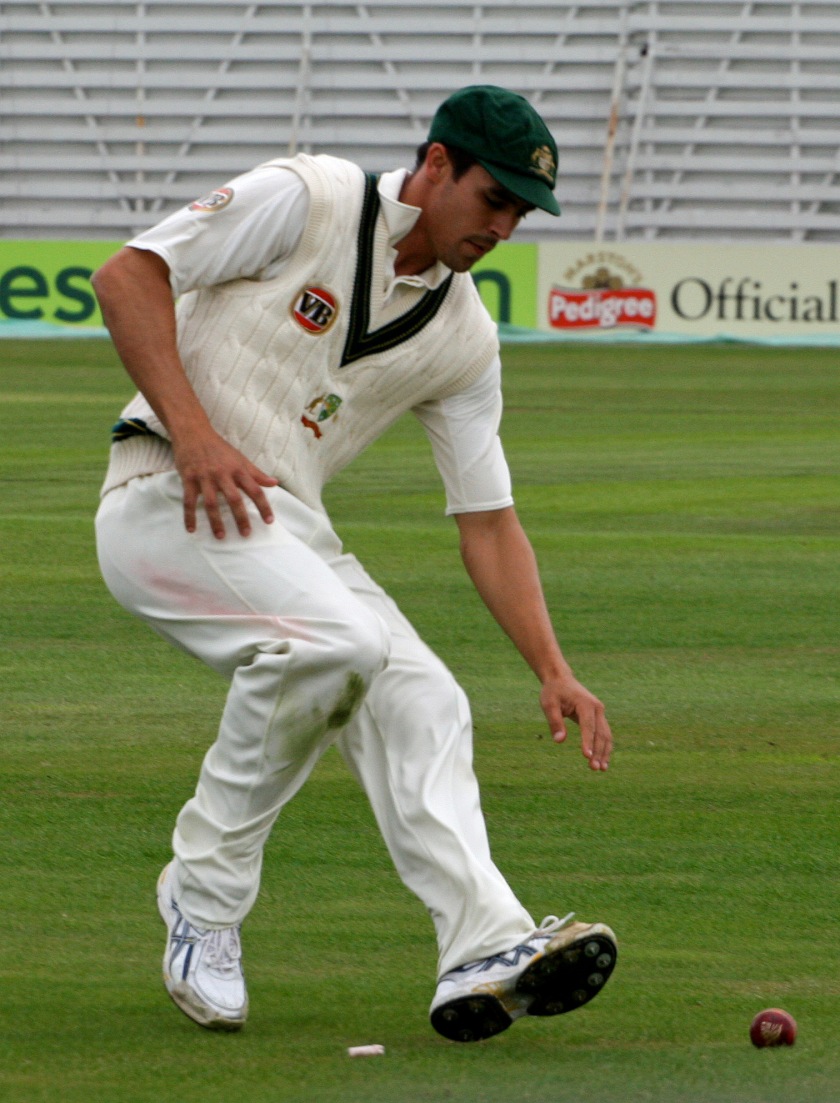
Mitchell Johnson fielding during a tour match against Northamptonshire during the 2009 Ashes // Chris Brown
Indeed it does. So if Cricket Australia believes it is important enough to record this kind of data, why don’t we?
Obviously, Cricket Australia does it for strength and conditioning purposes. They monitor the players during a match to ensure that they prepare them for the work they have to endure at training. However, there is untold value in recording player sprint speeds, distances covered and number of sprint efforts.
Major League Baseball (MLB)’s Statcast system introduced a sprint speed metric during the 2017 season with the aim to more precisely quantify speed by measuring how many feet per second a player runs in his fastest one-second window.
Approximately seven full-effort strides can be captured over the course of a one-second window, so Statcast’s sprint speed rewards those who can sustain their speed over a longer period of time. Sprint speed captures top running speed both on the bases and in the field. Measuring the sprint speed of fielders makes it possible to assess their speed to the ball.
Byron Buxton, one of the fastest players in the MLB achieved a sprint speed of 30.2 ft/sec (9.2 m/s) in 2017. The average sprint speed across the league was 27 ft/sec (8.23 m/s). For comparison, Johnson’s 33.1 km/h effort equates to 9.19 m/s, placing him above the average MLB player. It also means that if he and Buxton maintained their top speeds in a 100 m sprint, Buxton would win by 0.01 secs.
By using GPS units on players, it is also possible to measure how much distance a fielder covers over the course of a match. Distance covered is an increasingly visible statistic in soccer and is particularly useful for midfielders whose contributions can’t be measured by goals and assists alone. It’s also useful for assessing a player’s hustle in winning back balls in defence, as well as in kickstarting attacks and providing service to strikers.
Measuring the distance covered by cricketers adds potential value in ODIs and T20s, where players attempt to steal singles and twos and where fielders are moved to key catching and run-saving areas at various stages. In some T20s, where more than half the side doesn’t bat, this stat can quantify the value of every player on the field.
The 23 kilometres Johnson covered on Boxing Day 2013 includes every single delivery he bowled on that day. That’s exactly 25.6 metres each time he completed his run-up. Therefore, it must be theoretically possible to measure how far fielders travelled on “competitive” plays whenever they are called upon to chase a ball through the outfield.
This can add value to players such as Jordan Silk and AB de Villiers who are often posted on the boundary towards the end of an innings. It could be possible to find value in players who cover more territory in the outfield than those who often remain in the infield.
The sports drink-sponsored Bolt Rate named Aaron Finch as the fastest man between the wickets with a top speed of 30.15 km/h (8.37 m/s) between the wickets followed by Cameron Bancroft at 26.62 km/h (7.39 m/s). The details surrounding the actual speed tests are scarce and it is assumed that the players were wearing pads and other equipment at the time of the tests to simulate a match environment.
Sprint speeds should be measured and applied to fielders in order to gain a better understanding of who the fastest players in the field are. Players should be rewarded for their ability to move quickly and cover more distance in the field. Measuring fielder sprint speeds places greater emphasis on moving quickly to the ball. It might just be the difference between catching a tough chance or completing a tight run-out opportunity.
