
Ladder
1. New South Wales – 2-0 (2) | 3.80 BP, 15.80 points
2. Western Australia – 1-0 (2) | 4.13 BP, 11.13 points
3. Queensland – 1-0 (2) | 2.54 BP, 8.54 points
4. Victoria – 0-1 (2) | 3.52 BP, 4.52 points
5. Tasmania – 0-1 (2) | 3.13 BP, 4.13 points
6. South Australia – 0-1 (2) | 2.48 BP, 3.48 points
*As of 22 October 2019
Batting Statistics
New South Wales
Innings – 4
Wickets Lost – 26
Runs – 832 (including 35 sundries)
No. of balls – 1543
Average Score – 208
Strike/Rate – 53.92
Highest Score – 364 all out (vs Tasmania, Drummoyne Oval, 19/10/19)
Fours – 98
Sixes – 6
% scoring shots – 24.76%
% ones – 13.80%
% boundaries – 6.74%
Runs Above Average – +127.61
Queensland
Innings – 4
Wickets Lost – 36
Runs – 835 (including 53 sundries)
No. of balls – 1808
Average Score – 208.75
Strike/Rate – 46.18
Highest Score – 268 all out (vs New South Wales, Brisbane, 12/10/19)
Fours – 100
Sixes – 0
% scoring shots – 20.30%
% ones – 9.85%
% boundaries – 5.53%
Runs Above Average – -21.41
South Australia
Innings – 3
Wickets Lost – 26
Runs – 1084 (including 36 sundries)
No. of balls – 1888
Average Score – 361.33
Strike/Rate – 57.42
Highest Score – 6 for 671 (vs Victoria, St. Kilda, 11/10/19)
Fours – 139
Sixes – 10
% scoring shots – 24.95%
% ones – 12.55%
% boundaries – 7.89%
Runs Above Average – -2.82
Tasmania
Innings – 3
Wickets Lost – 30
Runs – 805 (including 69 sundries)
No. of balls – 1846
Average Score – 268.33
Strike/Rate – 43.61
Highest Score – 397 all out (vs Western Australia, Perth, 10/10/19)
Fours – 86
Sixes – 4
% scoring shots – 20.10%
% ones – 11.54%
% boundaries – 4.88%
Runs Above Average – -61.28
Victoria
Innings – 3
Wickets Lost – 26
Runs – 1143 (including 33 sundries)
No. of balls – 2027
Average Score – 381
Strike/Rate – 56.39
Highest Score – 6 for 616d (vs South Australia, St. Kilda, 10/10/19)
Fours – 120
Sixes – 18
% scoring shots – 28.52%
% ones – 18.11%
% boundaries – 6.81%
Runs Above Average – -154.44
Western Australia
Innings – 4
Wickets Lost – 29
Runs – 1248 (including 75 sundries)
No. of balls – 2148
Average Score – 312
Strike/Rate – 58.10
Highest Score – 9 for 519d (vs Victoria, Perth, 19/10/19)
Fours – 156
Sixes – 5
% scoring shots – 25.70%
% ones – 13.73%
% boundaries – 7.50%
Runs Above Average – +111.86
*As of 22 October 2019
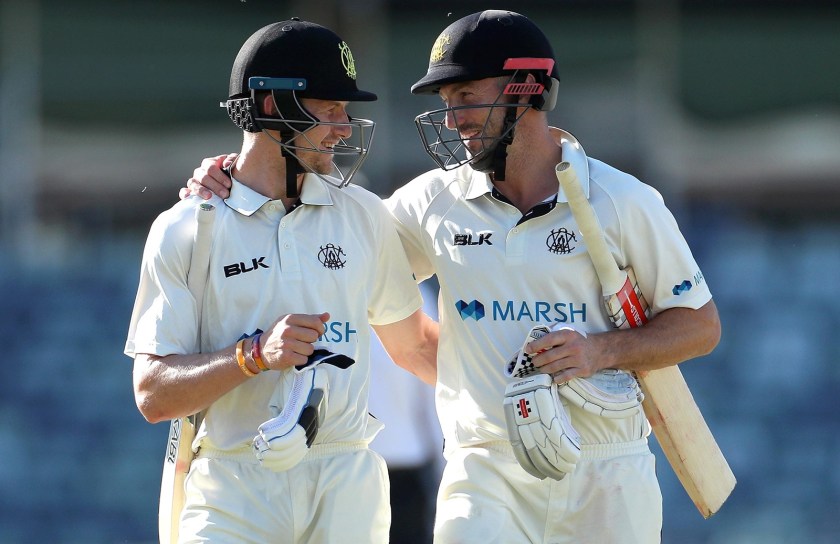
Cameron Bancroft and Shaun Marsh celebrate a comfortable 9-wicket win over Victoria // CA Digital Media
Bowling Statistics
New South Wales
Innings – 4
Overs – 327.1
No. of balls – 1967
Maiden overs – 97
Wickets – 40
Runs conceded – 766 (+ 8w, 4nb, 51 byes)
Bowling average – 20.73
Bowling Strike/Rate – 49.18
Economy rate – 2.34 runs per over
Best Bowling Figures – 10/140 (vs Tasmania, Drummoyne Oval, 20/10/19)
Home Bowling Average – 20.40
Away Bowling Average – 21.05
% wickets – 100%
Wickets Above Average – +7.15
Defence Efficiency Record – 2.03%
Queensland
Innings – 4
Overs – 257.5
No. of balls – 1549
Maiden overs – 69
Wickets – 34
Runs conceded – 802 (+ 9w, 2nb, 22 byes)
Bowling average – 24.56
Bowling Strike/Rate – 45.56
Economy rate – 3.11 rpo
Best Bowling Figures – 10/192 (vs South Australia, Brisbane, 20/10/19)
Home Bowling Average – 24.56
Away Bowling Average – N/A
% wickets – 85%
Wickets Above Average – -1.05
Defence Efficiency Record – 2.19%
South Australia
Innings – 3
Overs – 288.2
No. of balls – 1731
Maiden overs – 41
Wickets – 22
Runs conceded – 996 (+ 4w, 1nb, 29 byes)
Bowling average – 46.82
Bowling Strike/Rate – 78.68
Economy Rate – 3.46 rpo
Best Bowling Figures – 10/264 (vs Queensland, Brisbane, 18/10/19)
Home Bowling Average – N/A
Away Bowling Average – 46.82
% wickets – 73.33%
Wickets Above Average – -2.53
Defence Efficiency Record – 1.27%
Tasmania
Innings – 4
Overs – 324.5
No. of balls – 1977
Maiden overs – 53
Wickets – 31
Runs conceded – 1057 (+ 13w, 28nb, 32 byes)
Bowling average – 36.45
Bowling Strike/Rate – 63.77
Economy rate – 3.26 rpo
Best Bowling Figures – 10/337 (vs Western Australia, Perth, 10/10/19)
Home Bowling Average – N/A
Away Bowling Average – 36.45
% wickets – 77.5%
Wickets Above Average – -4.60
Defence Efficiency Record – 1.57%
Victoria
Innings – 3
Overs – 341.5
No. of balls – 2053
Maiden overs – 60
Wickets – 16
Runs conceded – 1159 (+ 5w, 2nb, 33 byes)
Bowling average – 74.94
Bowling Strike/Rate – 128.31
Economy rate – 3.39 rpo
Best Bowling Figures – 9/519 (vs Western Australia, Perth, 19/10/19)
Home Bowling Average – 111.83
Away Bowling Average – 52.80
% wickets – 53.33%
Wickets Above Average – -1.80
Defence Efficiency Record – 0.78%
Western Australia
Innings – 3
Overs – 329.4
No. of balls – 1983
Maiden overs – 73
Wickets – 30
Runs conceded – 866 (+ 15w, 5nb, 38 byes)
Bowling average – 30.80
Bowling Strike/Rate – 66.10
Economy rate – 2.63 rpo
Best Bowling Figures – 10/186 (vs Victoria, Perth, 20/10/19)
Home Bowling Average – 30.80
Away Bowling Average – N/A
% wickets – 100%
Wickets Above Average – +2.63
Defence Efficiency Record – 1.51%
