
Victoria 6-616d (Nic Maddinson 224, Tom Andrews 2-130) drew South Australia 6-671 (Tom Cooper 271, Chris Tremain 2-56)
Queensland 153 all out (Marnus Labuschagne 69, Harry Conway 5-17) & 268 all out (Joe Burns 52, Harry Conway 5-39) lost to New South Wales 9-288d (David Warner 125, Cameron Gannon 5-94) & 5-134 (Daniel Hughes 66, Michael Neser 3-42)
Western Australia 337 all out (Marcus Stoinis 61, Jackson Bird 3-51) & 9-383 (Shaun Marsh 85, Jackson Bird 5-78) drew Tasmania 397 all out (Tim Paine 121, Jhye Richardson 3-58)
An exciting opening round of the Sheffield Shield has come to a conclusion. We’ve seen great bowling spells, big partnerships and a ridiculous amount of runs have been scored across the three opening four-day matches.
Following so much action, there are plenty of numbers to be crunched before we can figure out which teams and players are hot and who is not after round one. Fair warning, terrible puns ahead…
HARRY PAVES THE CON-WAY
With six members of Australia’s Ashes touring party in action at the Gabba, it was 27-year-old Harry Conway who upstaged his star-studded teammates in New South Wales’ opening match of the 2019-20 Sheffield Shield season against the Queensland Bulls. The Blues boasted the likes of Mitchell Starc, Trent Copeland and Sean Abbott in their battery, but it was Conway who dismantled the hosts’ batting line-up in fast bowler-friendly conditions to collect 5-17 from 13 immaculate overs before repeating the feat with 5-39 from 17.5 overs in the second innings.
Conway didn’t allow the Queenslanders to free their arms at any time with the hosts not scoring off 45.9% of his overs leading to an incredible economy rate of just 1.84. The average dismissal rate in Test matches over the last 20 years is about 1.5% — that’s a wicket every 65 balls. Furthermore, 90% of all deliveries have a wicket probability value of less than 3%. Conway took a wicket with 5.4% of all deliveries he bowled and took half (50%) of New South Wales’ wickets.
Having played just 19 first-class games, Conway is aware his place in the New South Wales pecking order. However, more incredible performances like these might see him move up a few rungs in the near future. Watch this space…
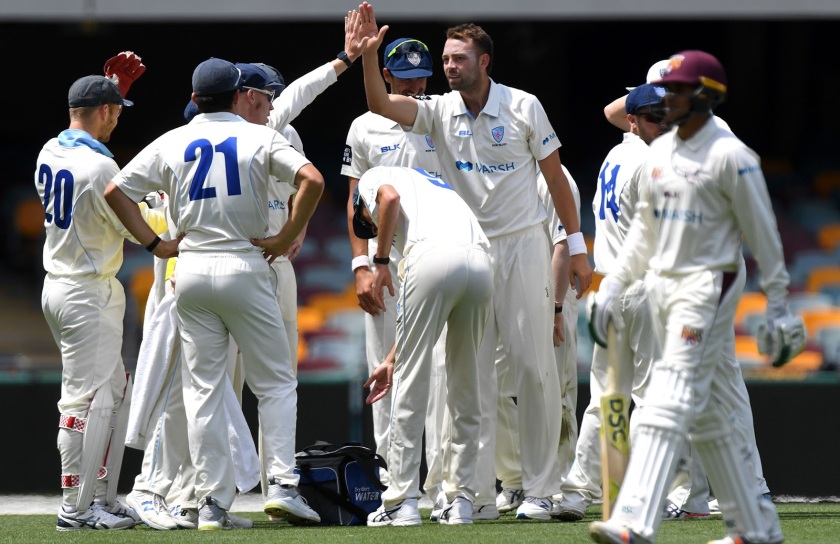
Harry Conway celebrates with his teammates after dismissing Queensland’s Usman Khawaja // CA Digital Media
AGAR-RESSIVE INNINGS DISPLAYS LOWER ORDER IMPORTANCE
Jackson Bird was in full flight on the final day of Tasmania’s opening Sheffield Shield clash against Western Australia at the WACA Ground. Powered by Bird’s 5-78, Tasmania seemed on the verge of snaring an unlikely victory when the fast bowler dismissed Josh Inglis for 40 to leave the hosts at 9-298. Battling a hamstring injury, and with Cameron Bancroft as a runner, Joel Paris joined Ashton Agar at the crease in a desperate effort to salvage the match. And salvage they did.
Agar and Paris combined for a an 85-run 10th-wicket partnership, taking the Warriors to 9-383 before play was called off shortly before tea. Paris’ 23 not out off 53 balls frustrated the visitors while Agar scored 72.9% of the 85 runs and reached 76 not out off 111 balls, including 10 fours. While we all know that this isn’t the first time Agar has done something like this, his innings highlights the importance of lower order batting. Coming in to bat at number 8, Agar’s 96 runs for the match was more than six out of Western Australia’s top seven. Marcus Stoinis was the only Warriors player to outscore Agar.
The average batting score at the WACA Ground during this match was 31.18. This means that an average batsman would theoretically score 31 runs per innings under the same batting conditions (62 for the match). Therefore, Agar’s contribution of 96 was 33.64 runs above what an average batsman would have made. In short, that’s 33 runs Western Australia wouldn’t have scored without Agar.
Having a side that bats all the way down the order is important in ensuring a team maximises all of its potential run-scoring ability. The Australian Test team often puts this theory to the test with Pat Cummins, Mitchell Starc, Nathan Lyon, Josh Hazlewood, and before that Mitchell Johnson and Ryan Harris, frequently adding valuable runs to the team’s total. It seems that it’s becoming more and more important for bowlers to be able to bat a bit too and especially so in scenarios such as these. Bowling needs to remain a priority, but performances like these add extra value to players.
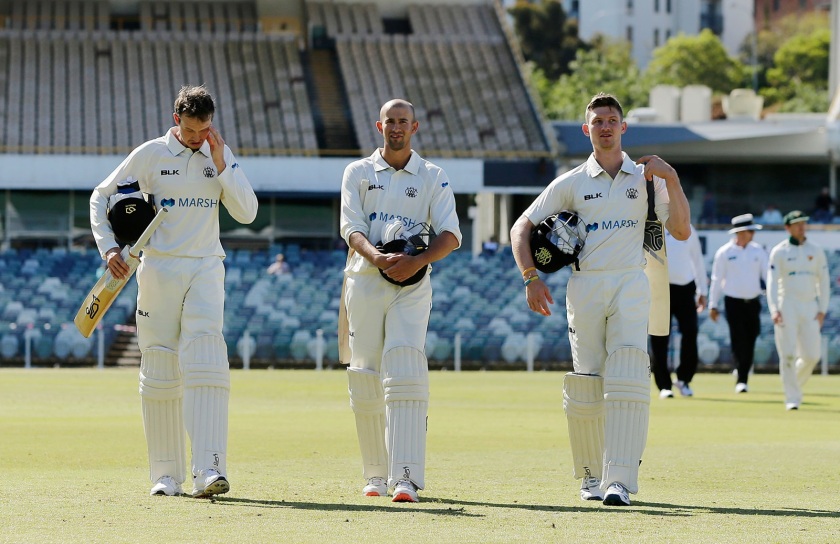
Ashton Agar walks off triumphantly with Joel Paris and Cameron Bancroft after securing a draw against Tasmania // CA Digital Media
SA AND VIC REACH RUN-SCORING JUNCTION
This week’s clash between Victoria and South Australia saw three batsman reach fifty, four batsmen reach one hundred and two batsman reach two hundred. Neither side could find a way to achieve a result in the drawn match, with the stupefying stalemate reflecting poorly on the curators of the lifeless Junction Oval pitch which showed no signs of final-day wear and tear. All up, 1,287 runs were scored and just 12 wickets were taken across the game’s four days.
Captains Peter Handscomb and Travis Head were unable to reach an agreement on a target for a final-day run-chase. Handscomb in particular lit a fuse by suggesting that South Australia was responsible for allowing the game to descend into a farce and making a pointed dig at the Redbacks’ poor recent first-class record after play on day three.
The net result was a scorecard that would make even the most astute cricket fan pull a double-take and thinking that Tom Cooper’s ludicrous 271 off 347 balls is perhaps some kind of typo remains a forgivable offence even now. Batting on what he conceded to be the flattest pitch he’s ever played on, Cooper was able to cash in and make the most of the Junction Oval run-fest to blast his 13th first-class century. Combining with first Alex Carey (117) and then Tom Andrews (101), Cooper was not only involved in two partnerships worth over 200, but he also compiled 41.6 percent of South Australia’s mammoth score of 6/671.
Cooper scored off 38.9% of all 347 deliveries he faced and of all those deliveries he faced, he scored a single off 23.9% of them. For comparison, teammate Alex Carey had a scoring shot percentage of 33.9%, while Tom Andrews scored off 32.7% of all the deliveries he faced. Meanwhile, Victoria’s Nic Maddinson, Marcus Harris and Will Pucovski scored off 37.2%, 35.0% and 36.7%, respectively.
Whilst more important in Twenty20 cricket, these high scoring rates highlight versatility, an outstanding ability to turn over the strike and suggests that each batsman is capable of a wide array of shots. These are valuable assets which shine through in a performance such as Tom Cooper’s that’s unlikely to be replicated any time soon either by himself, or indeed anybody else for that matter.
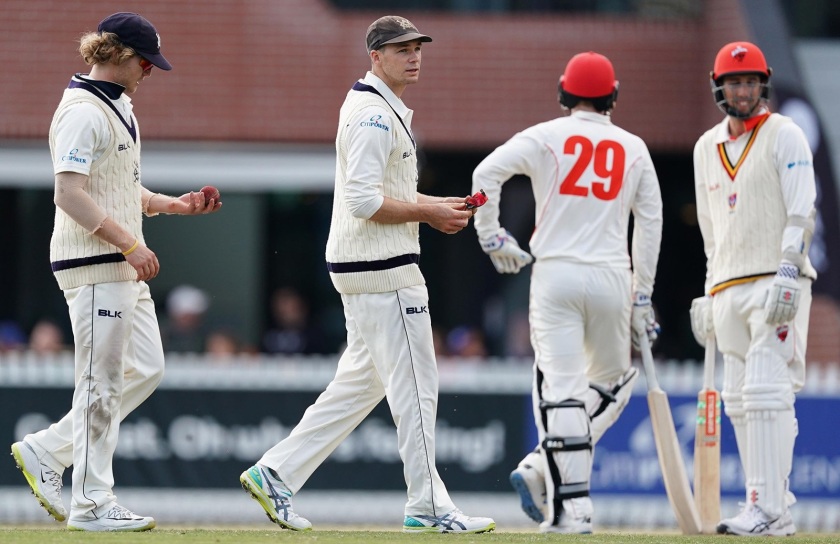
Victorian captain Peter Handscomb made it no secret that he held South Australia responsible for allowing the game to descend into a farce // CA Digital Media
LIVIN IN A BATSMAN’S PARADISE
So we’ve just discussed how 1,287 runs were scored and just 12 wickets were taken across four days during South Australia’s opening match stalemate against Victoria. By taking a leaf out of Baseball’s book, it is possible to compare the lifeless conditions at Junction Oval with the two other venues used this week – the Gabba and the WACA.
Baseball’s Park Factor is a statistic that indicates the difference between runs scored in a team’s home and away games. Park Factor is helpful in assessing how much a specific ballpark contributes to the offensive production of a team or player and is designed to predict whether a venue is batter or pitcher “friendly”. Similar assessments are made subjectively in cricket with the differences between playing in English conditions and playing in Australia or the subcontinent the feature of many discussions.
Park Factor then, reflects the relative ease or difficulty in scoring or preventing runs at the venue which gives some context to a player’s performance. Based on the ratio of runs scored to wickets taken at each venue, our Park Factor model spits out a single value that is able to reflect both batting and bowling components. Anything higher than 100 is in favour of the batsmen, while anything lower than 100 suggests bowler-friendly conditions.
At the Gabba, for instance, neither side was able to post a score higher than 290 (granted New South Wales didn’t need to in their second innings) across their four days of cricket. A total of 843 runs for 34 wickets gives the Gabba a park factor of 42.29 which is obviously heavily in favour of the bowlers. This gives extra weight to stand-out performances such as Marnus Labuschagne’s dual-fifties, David Warner’s first innings century and Daniel Hughes’ match-winning 66 because they were scored in conditions conducive to fast-bowling and where the average batting score was just 19.98.
During the three innings played at the WACA, both Tasmania and Western Australia (twice) were able to achieve a score in excess of 300 for a total of 1,117 runs for 29 wickets. The park factor at the WACA is measured at 83.18 which also suggests bowler-friendly conditions. Unlike the Gabba however, the average batting score at the WACA was 31.18 which suggests that there was plenty of runs on offer for both sides, especially when seven batsmen were able to pass fifty.
Returning to the Junction Oval run-fest, both Victoria and South Australia were able to pass 600 as just 12 wickets fell across four days of cricket. With a total of 1,287 runs scored and just 12 wickets, the park factor at Junction Oval is 344.73. Yep… You read that right. A park factor like that suggests that the best plan of attack for bowlers is to not bowl at all because less runs would be scored that way. This alarming figure goes hand-in-hand with the venue’s average batting score of 78.69, meaning that if a batsman scored anything less than that, they’d be below average. Speaking of which…
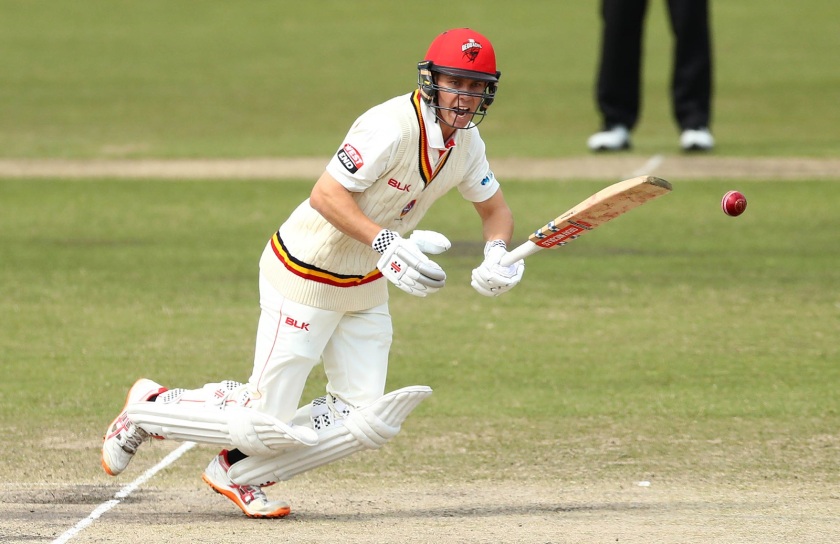
South Australia’s Henry Hunt on his way to an impressive 75 on first-class debut // CA Digital Media
PUNCHING ABOVE AVERAGE
Brand new for the 2019-20 Sheffield Shield season is our Runs Above Average statistic. In Runs Above Average, we take park factor one step further by calculating the average batting score for each match and measuring it against the total runs of each batsman to see how well they performed given the conditions they batted in. The formula for the average batting is as follows:
(Total Runs Scored at Venue – Total Number of Sundries) / Total Number of Batsmen*
*Note that this is the number of batsmen who played an innings, not the number of wickets taken e.g. If a side gets bowled out, the total number of batsmen is 11. If the bowling side takes 6 wickets and 2 batsmen remain not out, the total number of batsmen is 8.
As mentioned above, we calculated the average batting score for the Gabba (19.98), the WACA (31.18) and Junction Oval (78.69). These figures are the expected number of runs a batsman will score per innings. We used this formula earlier to calculate that Ashton Agar’s total contribution of 96 runs was 33.64 runs above what an average batsman would have made. This means that Western Australia scored 33 runs more than what they would have if they didn’t have Agar.
Such a low average batting score at the Gabba means that from two innings, David Warner (125) scored 85.04 runs above the expected number of runs for the match. Queensland’s Marnus Labuschagne’s dual-fifties – equaling 121 – was 81.04 runs above the average. In conditions better suited to bowling, Warner and Labuschagne’s figures highlight how valuable their performances were to each of their respective teams. On the flip side, Steve Smith’s false start to the season (0 & 21) saw the former Australian captain score 18.96 runs below the average. Teammate Moises Henriques (-31.96) was the lowest of the New South Wales batsmen while Charlie Hemphrey (-30.96) was the lowest for Queensland.
In the west, Tim Paine’s second ever first-class century was enough to see him score 89.82 runs above the average while Western Australia’s Marcus Stoinis was 55.64 runs above the average courtesy of a pair of fifties. Having made just 44 runs at an average of 11.00 in the 2019 Ashes series, Cameron Bancroft’s 30 and second-innings duck put him 32.36 runs below the average. Fellow opener Sam Whiteman (0 & 16) was also 46.36 runs below the average making the pair the least-prolific opening partnership this season.
Finally, the flat pitch at Junction Oval was good news for South Australia’s Tom Cooper (+192.31), Alex Carey (+38.31) and Tom Andrews (+22.31), as well as Victoria’s Nic Maddinson (+145.31), Marcus Harris (+37.31) and Will Pucovski (+44.31) who all finished miles above the average. However, such a high average batting score leaves half-centurions Henry Hunt (-3.69), Travis Head (-27.69) and Aaron Finch (-21.69) well below the average.
The 2019-20 Sheffield Shield season continues on 18 October where the players, in particular batsmen, will have another opportunity to impress selectors ahead of the upcoming Test series against Pakistan in November.
