Big Bash League: Round 2 by the numbers

Blog

The matches keep coming as we dive headfirst into the second round of the 2018-19 Big Bash League season. The tournament continues to be a source of entertainment over the Christmas holidays and provides a stark contrast against the Boxing Day Test in Melbourne.

It is at this point where we start to see which players are in red hot form and which are not at this early stage. With that in mind, here are just five new statistics we are using to evaluate each team’s 18 players:

1) Boundary Rate

Boundary Rate, or balls per boundary, gives us an indication of how often batsman are finding the fence. It allows us to separate monster boundary hitters, such as Chris Lynn, from those who are not regular boundary scorers.

Interestingly enough, as it stands Lynn ranks just 25th on our list of top boundary hitters this season. After struggling to find the rope often at Metricon Stadium, the powerful Queenslander is hitting a boundary every 6.3 balls.

The batsmen at the top of the list are not who you expect, but there is a reason for that. Afghanistan’s Rashid Khan seemingly can do no wrong with ball or bat and tops our boundary rate rankings scoring a boundary every 3 deliveries after hitting two fours and two sixes in Adelaide Strikers’s meagre 88 against Perth Scorchers.

Next on the list is Sydney Thunder fast bowler Daniel Sams with 4 and Brisbane Heat opener Max Bryant with 4.3. Englishman Jos Buttler sits fourth on the list of top run-scorers this season and it is clear from looking at his boundary rate of 4.4 that he is also scoring his runs rapidly. Following a 63 against the Sydney Sixers, Buttler will definitely be one to watch as the tournament progresses.

jos-buttler-63-sixers

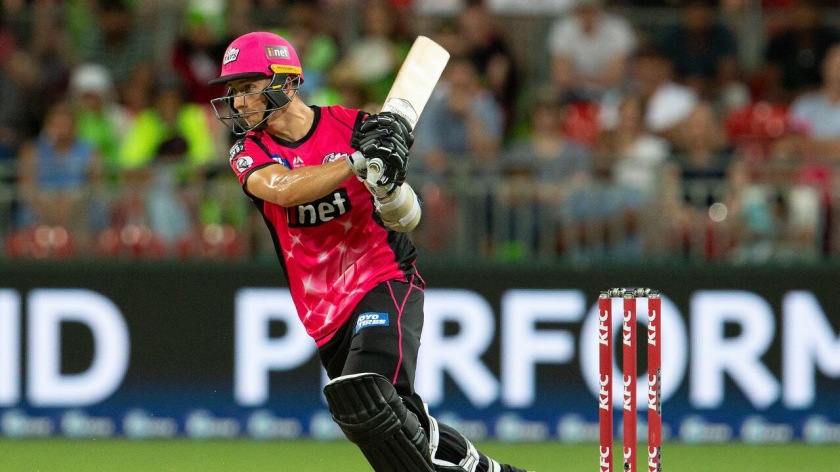
Englishman Jos Buttler is hitting a boundary every 4.4 balls this season // Herald Sun

2) Bowler Control Index

One of methods baseball analysts use to measure a pitcher’s ability is the power finesse ratio. The power finesse ratio estimates the number of times the pitcher rather than the batter influences the outcome of an at-bat. Therefore, the Bowler Control Index (BCI) calculates the percentage of bowler-controlled deliveries out of the total number of balls bowled.

It should come as no surprise then, that the bowler in control of the majority of their deliveries is Adelaide Strikers’ Rashid Khan (65.3%). What you may not have realised is that David Willey (60) ranks second highest followed by the always economical Peter Siddle (58.3). Stephen O’Keefe (52), Jason Behrendorff (51.4) and Billy Stanlake (50) round out the top six.

If these are the bowlers with the most control, then who are the bowlers with the least control? Interestingly, spin bowlers have less control. Part-timers Ashton Turner (0) and Glenn Maxwell (11.1) rank lowest followed by the Sydney Sixers’ Lloyd Pope (13.3). Ashton Agar and Michael Beer (both 16.7) complete the bottom five.

3) High and Low Conceding Overs

Another statistic being measured by us this season is the number of runs scored off each of the bowlers’ overs. Specifically, how many overs where less than three runs were scored, how many overs where more than six runs were scored and how many overs where more than ten runs were conceded. Used in conjunction with a bowler’s economy rate, this can be used to further analyse how successful a bowler has been at defending runs.

The bowlers with the most overs where less than three runs were scored are Rashid Khan and Jason Behrendorff (both 4). While Khan’s economy rate is better than Behrendorff (3.42 to Behrendorff’s 5.08), the fast bowler is the only player in the tournament to have bowled consecutive overs of less than three runs… Twice.

Stephen O’Keefe (3) also has an economy rate below six as has Jhye Richardson (2) after his incredible spell of 3 for 7 against Adelaide Strikers. Melbourne Renegades’ Jack Wildermuth (2) has bowled the most less than three run overs with an economy over 6.

On the flip side, Michael Neser (6), Tom Curran and Ben Cutting (both 5) have bowled the most overs where more than six runs were scored. Meanwhile, Billy Stanlake has conceded more than ten runs off an over on 6 occasions. That is half of Stanlake’s overs bowled in the tournament so far.

4) Team Wicket Percentage

An adage used in games and military combat states that “the best defence is a good offence”. This is especially true in the case of the bowlers in the Big Bash League. The ability for teams to take wickets and bowl opposition sides out is a crucial skill. It’s why the Perth Scorchers have been so dominant in the early years of the competition and it was a critical part of the Adelaide Strikers’ title-winning season last year.

At this point in the 2018-19 edition of the Big Bash League, the team that has done this most successfully is the Sydney Sixers. The Sixers have taken 85% of all available wickets this season at a strike rate of 14.2. Sydney Thunder have a better strike rate of just 11.2 but, have only taken 75% of available wickets. Hobart Hurricanes and Melbourne Renegades have also taken 75% of available wickets with strike rates over 15.

Whilst early days just yet, each team’s wicket percentage will become important as the tournament goes on when it becomes critical for teams to close out tight matches.

image

Sydney Sixers have taken 85% of all available wickets this season at a strike rate of 14.2 // AAP/Steve Christo

5) Net Contribution

Finally, net contribution is being used by us this season to measure a player’s defensive liabilities against offensive output. So far, this statistic has been used as an essential evaluation tool for wicketkeepers, especially in an age where pure glovemen are being cast aside in favour of specialist batsmen who can keep a bit. Net contribution is calculated on a match basis rather than an innings basis because there may be occasions where wicketkeepers don’t bat.

The most productive wicketkeeper so far has been Sydney Thunder’s Jos Buttler. With scores of 20 and 63 in his opening matches and no byes or dropped catches conceded, Buttler has contributed 41.5 runs per match to the Thunder. Alex Carey’s scores of 70, 5 and 11 with one run cost as the result of an overthrow puts him second with 28.3 runs contributed per match.

The worst offender with the gloves this season has been Matthew Wade of the Hobart Hurricanes. Wade’s half-century against the Melbourne Stars put him back into positive figures at least, but a dropped catch off Ben Cutting cost his side an extra 55 runs. This means that, Wade has contributed just 1 run per match.

Although this statistic is only being used to measure wicketkeepers at the moment, there is no reason why it can’t be applied to the other nine fielders. Melbourne Stars’ Nick Larkin has been impressive with the bat scoring 28 and 45 in his first two innings this season. However, Larkin has now dropped three catches this season costing the Stars a total of 71 runs. Just like Wade, Larkin has contributed just 1 run per match to his team.

nick-larkin-drop-gif

Nick Larkin drops his third catch of the summer, this time against the Hobart Hurricanes.

Big Bash League: Round 1 by the numbers

Blog

The Big Bash League is back! The first five matches of the 2018-19 edition have already lived up to the hype with big hits, destructive bowling, great catches, confusing run outs and, unfortunately, rain.

As with all the entertainment the BBL provides, there are plenty of numbers to be crunched to figure out which teams and players are hot and who is not after round one. Here are some of the things we learned from the opening round of BBL|08:

1) Batting Second isn’t always the answer

Prior to the invention of Twenty20 cricket, it was a firmly held belief by captains that should you win the toss, you should elect to bat first. In fact, an old observation by former Australian captain Ian Chappell says that “when you win the toss, you bat first nine times out of ten; the tenth time you think about it and bat first anyway”.

Chappell’s statement seems to have been inverted in recent seasons of the BBL with most franchise captains believing that batting second i.e. chasing, results in more wins, more often. In BBL|06 for example, twenty-seven out of 34 teams that won the toss opted to bowl. The seven who decided to bat first all regretted it, losing every single time.

However after the first five matches this season, three teams have won the match having batted first. The proportion of wins batting first to batting second sits at a 60-40 per cent split, respectively.

What’s more interesting to note is that only Moises Henriques of the Sydney Sixers elected to bat first. The other two teams – Sydney Thunder and Hobart Hurricanes – were both sent in to bat by the opposition captain.

It’s safe to assume that for now teams and captains will continue to send their opponents in to bat first, but it’s clear that setting a decent score and subsequently defending it is not a bizarre notion.

chris-lynn-dismissed

Chris Lynn’s whirlwind cameo of 33 came to abrupt end courtesy of Peter Siddle // AAP, ‘Gabba

2) Catches really do win matches

It’s one of the oldest adages in the cricket playbook. Catches win matches. In the first five matches played, this statement has been proven true on multiple occasions.

Jake Lehmann was lucky in the sense that when he dropped Brisbane Heat’s Max Bryant in the tenth over of the tournament opener at the ‘Gabba, the 17-year-old was caught by Rashid Khan the following delivery.

Ironically, it was Bryant himself who was less fortunate when he grassed an opportunity off the bat of Jake Weatherald when the opener was on just 1.

Weatherald added just 16 more runs to his overall tally, which may not seem like much. However when you consider that the Heat bowlers took the run chase to the final over, an additional 16 runs may have been too big a mountain for the defending champions to climb.

Another example was Ashton Agar’s dropped catch of Jordan Silk at the Sydney Cricket Ground. Agar dropped a simple return catch in the ninth over when Silk was on just 17. Silk went on to score 67 not out, a net cost of 50 runs, as part of a 124-run stand with Daniel Hughes that proved to be the difference between Sydney Sixers and Perth Scorchers.

Oddly, the highest net cost of the tournament so far – 55 runs – was still not enough for Brisbane Heat to overcome Hobart Hurricanes on the Gold Coast. Matthew Wade grassed a chance gloved by Ben Cutting down the leg side when the Heat all-rounder was on 3. Cutting went on to score his maiden BBL fifty and nearly proved the difference between the two teams.

3) Melbourne Stars are the worst offenders in the field

Melbourne Stars finished at the bottom of the ladder in the competition last season. It can be assumed that people weren’t expecting miracles from the relatively inexperienced team. At this point, there have been twelve catches dropped in the field. The Stars dropped three catches against their green shirt-wearing counterpart – Sydney Thunder – in Canberra.

Not only that, but it was Sydney Thunder’s Daniel Sams that survived all three opportunities. Adding to the woes was the fact that two of the three were dropped by the same person. Nick Larkin had two opportunities to dismiss Sams at long on each within an over of each other.

The first was in the air for a long time, but Larkin didn’t sprint in and was forced to vainly dive full length to try and catch it. He also misjudged the second chance and ran in a touch too far before jumping up with one hand only for the ball to burst through and reach the boundary. Larkin actually had an extra two or three metres behind him he could have used.

Larkin wasn’t the only Stars player struggling in the field. We observed Marcus Stoinis mis-field the ball three times, costing his side three runs. He was able to save one run later in the evening to earn back some respect.

Elsewhere, Jackson Coleman also mis-fielded the final delivery of Michael Beer’s opening over. Hit powerfully by Shane Watson, Coleman missed the ball at mid off and it raced to the boundary, costing his side four runs. In his defence, he got an awkward bounce that went straight through him.

nick-larkin-dropped-catch

Nick Larkin misjudges a second chance and has to jump up with one hand // Channel Seven

4) Relying on one batsman’s contributions will not win matches

Cricket already has numerous metrics which can be used to evaluate a batsman’s performances. Offensive rating systems that are designed to provide a better insight into a batsman’s ability can be found everywhere as different ways to evaluate players. In this way, it is implied that any batsman can be maniplulated to look better than they are depending on the rating system used.

One of the most relevant offensive rating systems, we believe, is the percentage of completed innings. This statistic provides us with the percentage of runs a player scores out of the team’s total. Using this, we can determine the players who are of the most value to their respective sides when compared to players from other teams.

Adelaide Strikers made 147 runs in their chase of Brisbane Heat’s meagre 146. Wicketkeeper Alex Carey scored 70 runs off 46 balls striking at 152.17. Anyone can see that Carey’s contribution proved to be the difference between the two teams however, his 70 runs equates to 49.3% of the Strikers’ final tally. That’s nearly half.

This highlights Carey’s importance to the Strikers’ batting order and poses a problem for the rest of the Strikers’ batsmen should Carey be selected for the upcoming ODI series against India beginning on 12 January.

D’Arcy Short was another batsman to score a half-century during the first five matches, also against Brisbane. Short’s 67 off 52 equates to 45.6% of the Hurricanes’ final score of 159. There’s no doubt that Short will also be in the frame for ODI selection. The second-highest contribution for the Hurricanes was 17% courtesy of Ben McDermott and his 25 off 16.

Sydney Thunder scored 181 runs off their 20 overs against Melbourne Stars, the highest of the tournament so far. Jason Sangha and Daniel Sams contributed 36.4 and 19.7 per cent of their team’s total, respectively, during their 77-run partnership in Canberra. That may be less than Carey and Short, but they also had valuable help from their team-mates.

Shane Watson contributed 12.7 per cent at the top of the order with Englishmen Jos Buttler and Joe Root contributing 11.6 and 10.4 per cent, respectively. Therefore, Sydney Thunder batted the best as one cohesive unit, as opposed to the Strikers and Hurricanes who relied heavily on individual performances of their players. This is going to be an important factor when it comes to crunch time later in the season.

d'arcy-short-contribution

D’Arcy Short contributed 45.6% of Hobart Hurricanes’ total of 159 against Brisbane Heat // AAP

5) Scoring consistently earns big runs

For a team called the Sixers, the Sydney-based franchise achieved this feat just three times during their opening match against the Perth Scorchers at Sydney Cricket Ground.

That being said, Daniel Hughes and Jordan Silk’s 124-run partnership was not only critical to the team’s success, but it was also scored at an incredibly fast rate. Hughes’ strike rate of 140.91 was fractionally better than Silk’s 136.73 and the pair were both striking quicker than the team’s overall strike rate of 133.33, but these numbers only tell half the story.

Hughes faced 44 balls on his way to 62 and scored at least one run off 34 of them. That’s 77.3%. His team-mate Jordan Silk was even better and scored off 43 out of his 49 balls faced during his innings of 67 not out. Silk’s scoring shot percentage of 87.8% is the highest out of any players in the league that have faced at least 10 deliveries at this point.

By comparison, Alex Carey scored off 67.4% of his deliveries faced during his innings of 70 against Brisbane Heat, Jason Sangha scored off 77.8% and Daniel Sams scored off 80.9% against Melbourne Stars. Melbourne Stars’ Nick Larkin is the next closest to Silk, scoring off 84.6% of his deliveries faced during his innings of 28 against Sydney Thunder in the rain-reduced match at Manuka Oval.

Sydney Sixers may have only hit three sixes this season however, the team’s scoring shot percentage of 77.5% is also significantly greater than any other team in the league. It’s a wonder why the Sixers are so often overlooked simply because they lack “big name” players. If the Sixers continue this scoring rate, they may yet become a dark horse when teams begin the scramble for a finals berth.

6) Dropped catches are costly, but can also be very odd

Cricket statistics can not only tell us which players are scoring quickly or taking the most wickets. They can, at times, be very odd. This BBL season, we have been tracking a range of factors around dropped catches such as who has dropped a catch, where they were fielding, what stage or over of the match and what the batsman’s score was when they were dropped.

We mentioned before how Ashton Agar dropped a return catch off Jordan Silk when the latter was on just 17. D’Arcy Short was also survived a caught and bowled chance during his innings against Brisbane Heat. Short came skipping down the ground and smashed the ball right past Mitchell Swepson’s left. While it may have been too difficult a chance for Swepson to grip, surviving a caught and bowled chance is not the only thing Silk and Short have in common.

Both were dropped in the ninth over with each their respective teams at least two wickets down for 56 runs. Furthermore, both players went on to score 67, each of their teams set their opponents a target of at least 160 runs and went on to win the game by at least 15 runs.

That may not be interesting, relevant, or more importantly that funny to some, but it certainly is peculiar. The truth really is more strange than fiction.