During a brutal afternoon, when temperatures spiked above 38°C, Australia’s besieged batters found runs hard to come by. Without a run on the sheet, and having survived a shout for lbw the previous delivery, opener Aaron Finch aimed to hit an expansive cover drive, but only managed to inside edge the ball into his stumps.
That set the tone for the rest of Australia’s innings. Debutant Marcus Harris appeared composed and worked hard to score 26 runs. Usman Khawaja worked even harder, taking 135 balls to reach 28—the slowest scoring rate of his Test career to this point—before he also succumbed to Ravichandran Ashwin, gloving a ball through to the keeper.
With Shaun Marsh out for 2 and Australia at 4-87, the home side could only take comfort knowing they were still in better shape than were India a day earlier.
With just 15 Test matches between them, Australia’s last specialist batting pair of Peter Handscomb and Travis Head mounted a comeback. Handscomb looked solid and scored five boundaries during his 34, while Head remains 61 not out at stumps.
Australia’s woes were kickstarted early on by tight defensive bowling by India’s seamers. India’s pace attack of Ishant Sharma, Jasprit Bumrah and Mohammed Shami bowled with discipline and kept run-scoring to a minimum.
The paceman were given plenty of support by the always reliable Ashwin. The off-spinner bowled 22 overs on the trot during the middle session of play. The quartet worked well to make their team’s first innings total of 250 look imposing.
The unique computer model used by CricViz enables the prediction of match outcomes, the interpretation of team and player performance and the anticipation of what is likely to happen next.
In September 2018, CricViz rolled out their brand new Wicket Probability model. The aim of the model is to estimate the probability of a specific delivery resulting in a dismissal of the batsman.
The model takes into account a range of different aspects and characteristics of a delivery which CricViz gets from official ball-tracking providers including bowler type, left/right-handedness, batting position, release speed, line, length, amount of swing and deviation of the ball off the pitch.
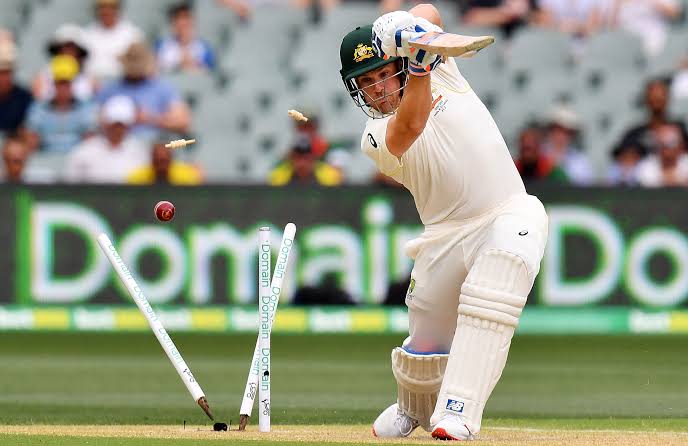
Ishant Sharma made a mess of Aaron Finch’s stumps with the third delivery of the innings // AAP
The output from the model tells us something which, in hindsight, should be pretty obvious and that is that wickets are pretty rare. In fact, the average dismissal rate in Test matches over the last 20 years is about 1.5%. In terms of bowling strike rate, that’s a wicket every 65 balls. 90% of all deliveries have a wicket probability value of less than 3%.
CricViz’s Wicket Probability model was rolled out just in time for it to be used during the Indian cricket tour of England in September. In that series, the aggregate strike rate was 50.9 balls per dismissal—the second lowest in any season of Test cricket in England since 1907.
Analysis of tracking-only Wicket Probability suggests that a significant reason for this decline was the level of batting difficulty. The wicket probability in 2018 of 1.97% is the highest recorded by CricViz ball-tracking database which began in 2006.
A wicket probability of 1.97% means that in strike rate terms we would expect a wicket to fall every 50.8 deliveries (100 divided by 1.97), eerily close to the actual aggregate strike rate of 50.9. This suggests that the batsmen performed at a typical level given the English conditions and the quality of the bowling rather than declining in batting standards.
Given the similarity between the aggregate strike rate and the results of the CricViz Wicket Probability model, it is possible for us to estimate a Wicket Probability for the First Test in Adelaide using the above formula.
India were bowled out for 250 after 88 overs in their first innings. That means the Australians bowled 528 legal deliveries to the away side, giving them a strike rate of 52.80. Therefore, Australia had an approximate Wicket Probability of 1.89% during the first innings.
So far, Australia has also faced 88 overs. Their stumps score of 7–191 after facing 528 legal deliveries, plus two no-balls, gives the Indian team a bowling strike rate of 75.71. Interestingly, this means that India (so far) has an approximate Wicket Probability of just 1.32%.
These numbers are made all the more intriguing when you consider that 2018 has been India’s most-prolific in terms of wickets taken. India have taken 134 wickets from 12 matches in 2018 at a strike rate of 47.7. It’s their best since 1979 when a team featuring Kapil Dev took 125 wickets from 17 matches at a strike rate of 61.8.
So, why is India’s Wicket Probability higher than Australia’s when their bowling was as disciplined as it was?
For starters, there is the sheer number of deliveries faced by each of Australia’s batsmen today. Of course, Cheteshwar Pujara’s dogged 246 balls spent at the crease was the backbone of India’s innings, but Pujara’s innings lasted 170 balls longer than the next highest (Ashwin’s 76-ball 25). The Indian team had a combined batting strike rate of 47.35.
By contrast, five of Australia’s batsmen spent more than 45 balls at the crease (Harris, Khawaja, Handscomb, Head and Cummins). Australia’s captain Tim Paine spent 20 balls at the crease before edging through to the keeper for 5 and Shaun Marsh lasted one ball less in his score of 2 striking at just 10.52.
Truthfully, if Australia had scored the same amount of runs as deliveries they faced, India would be staring down the barrel of an innings defeat. Instead, Australia’s meagre batting strike rate of 36.04 proves how successful India’s bowlers have been at minimising run-scoring.
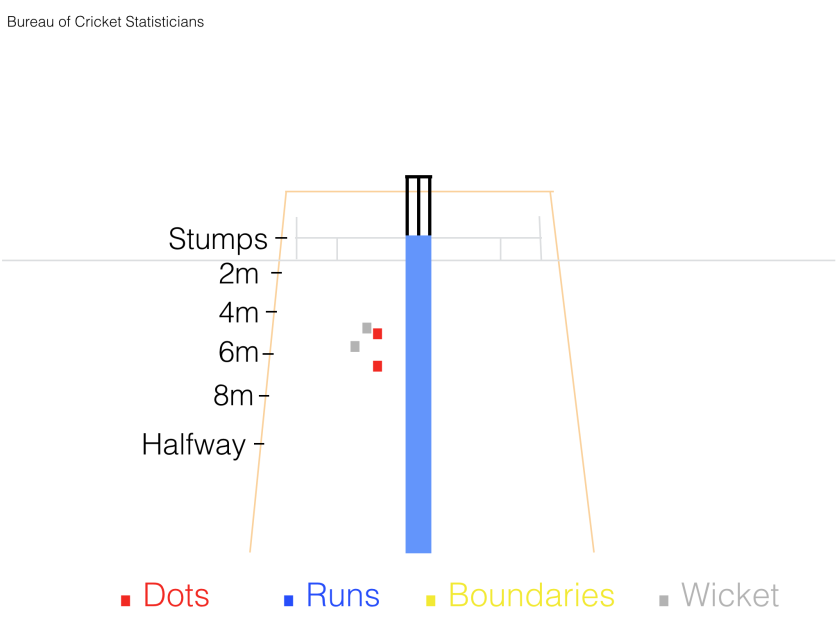
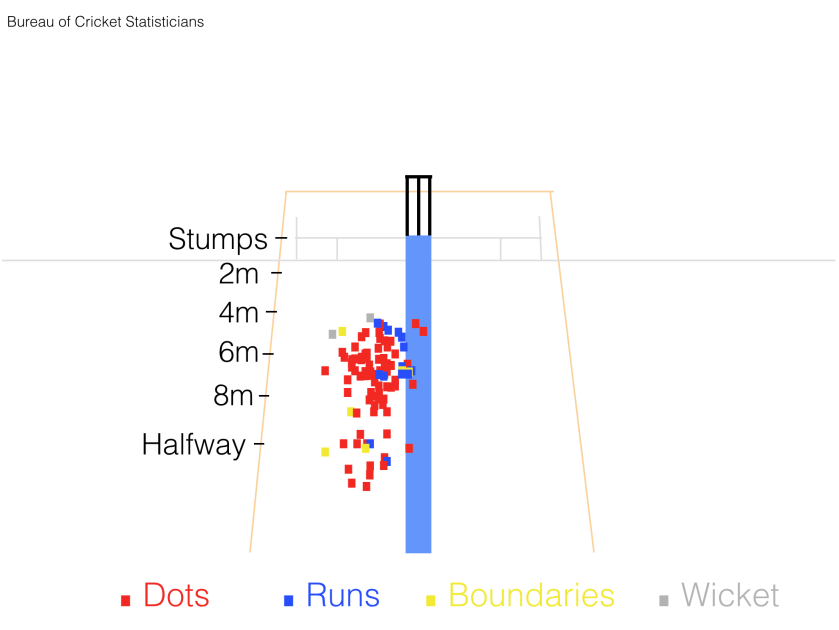
Another reason that India’s Wicket Probability is lower than Australia’s could be down to India’s length. India bowled a generally shorter length to the Australian batsmen compared to Australia’s bowlers yesterday. The below pitch map provides an example of the line and length India’s fast bowlers aimed at Peter Handscomb:
This pitch map displays the lines and lengths the Indian seamers bowled to Peter Handscomb // BCS Stats
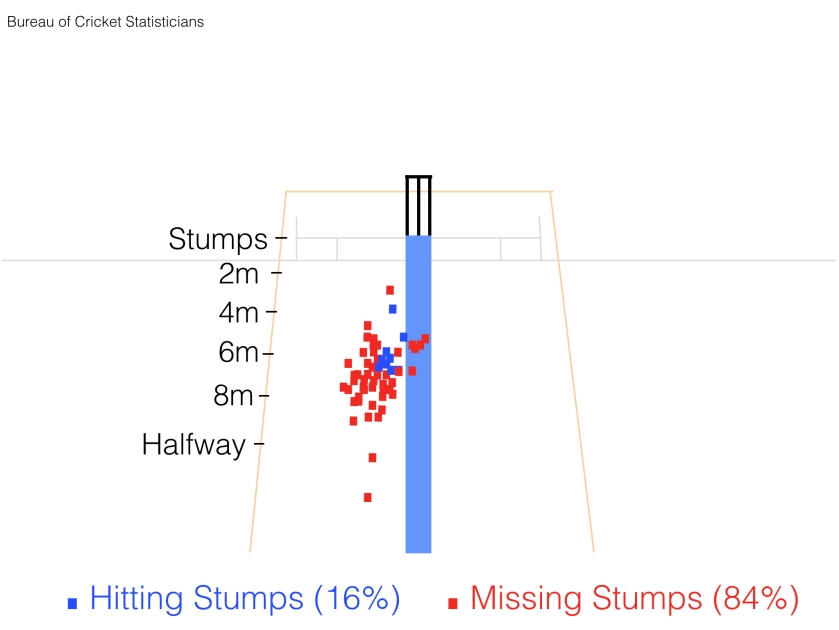
Looking at the pitch map we can see that just 16% of the deliveries Peter Handscomb faced would have gone on to hit the stumps. Bowling these lines and lengths means that even if Handscomb wasn’t standing at the crease, India would still miss the stumps 84% of the time.
Perhaps ironically, Handscomb eventually succumbed trying to late cut a delivery well outside off but despite this, it seems that the Indian seamers were content enough with just drying up the runs and allowing off-spinner Ashwin to do most of the damage at the other end.
They say that pressure at one end gets wickets at the other and Ashwin’s return of 3–50 off 33 overs seems to support this theory. In fact, Ashwin bowled the majority of India’s overs—37.5% to be exact. That being said, it was his tight bowling, which yielded nine maidens and an economy rate of just 1.51, that applied the brakes on Australia’s top order featuring many batsmen that pride themselves on scoring freely.
Australia needs just 59 runs tomorrow to pull level with India’s first innings total, but there is still a big mountain to climb. The hosts have just three wickets in hand and the nation’s hopes now rest in a man playing just his third Test match.
Can South Australia’s youngest Sheffield Shield captain help Australia dig its way out of a hole? Or will India’s bowlers continue their dominant display? Travis Head continues Australia’s rescue mission when play resumes tomorrow morning.
FACTS & FIGURES
- Aaron Finch has made his lowest Test score in every innings he has played.
- Usman Khawaja’s strike rate of 22.40 is his lowest ever in Test cricket.
- Shaun Marsh became the first Australian top-five batsman since 1888 to be dismissed for single figures in six consecutive Test matches. It was also the 5th time Marsh has been dismissed by Ravichandran Ashwin in 18 encounters.
- This was Travis Head’s 2nd fifty in 3 Tests and his 1st against India. It was also his first in Australia.